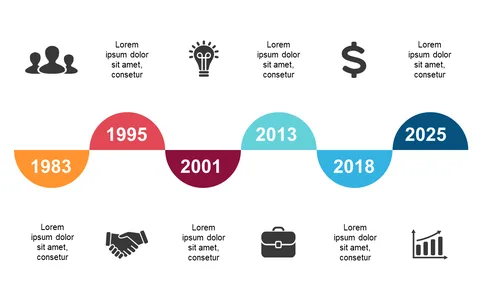
Highlight Key Dates with Horizontal Milestone Timeline
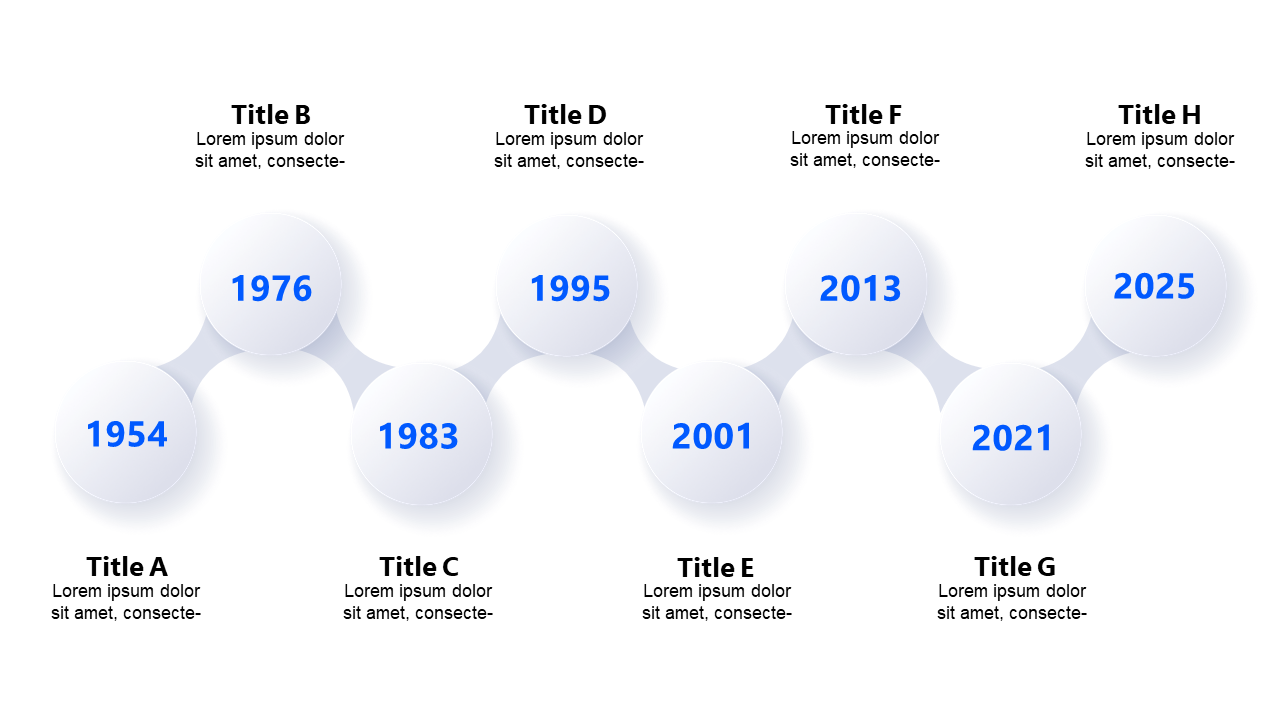
Product Description
Keeping track of key dates in your projects can be a challenge, especially when you’re juggling multiple timelines. It’s often difficult to present these milestones clearly without overwhelming your audience with too much information.
This horizontal milestone timeline helps you communicate significant events in a straightforward, visually appealing way. Whether you’re a project manager outlining a project timeline, a marketing professional presenting a campaign history, or a sales leader highlighting quarterly achievements, this layout fits perfectly into your needs. You can use it in team meetings, client presentations, or company briefings to ensure everyone understands the timeline of events.
For just $0.99, you can download this slide instantly and edit it to suit your specific needs in PowerPoint or Google Slides. Customize the markers and text to emphasize the key dates, ensuring your audience stays engaged and informed.
$0.99 – Purchase Checkout
Added to cart