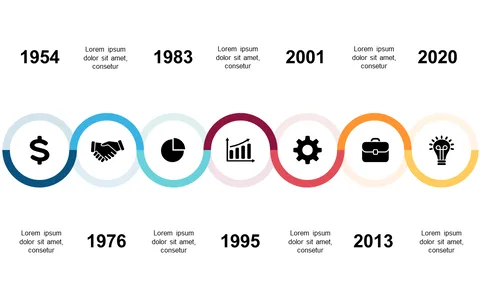
Visualize Key Events with Icon-Highlighted Timeline

Product Description
Presenting complex timelines can overwhelm your audience, leaving them confused about key events. This slide provides a straightforward way to visualize your milestones, clearly marked with icons that guide your audience through your narrative.
You’ll find this slide useful in various situations, whether you’re a product manager outlining a development timeline, a historian presenting a chronological overview, or a business analyst discussing project phases in a review meeting. Its design promotes clarity and engagement, helping you convey your message effectively.
For just $0.99, you can download this slide instantly and edit it in PowerPoint or Google Slides with ease. Customize the milestones to suit your specific needs and have it ready to go in a matter of minutes.
$0.99 – Purchase Checkout
Added to cart