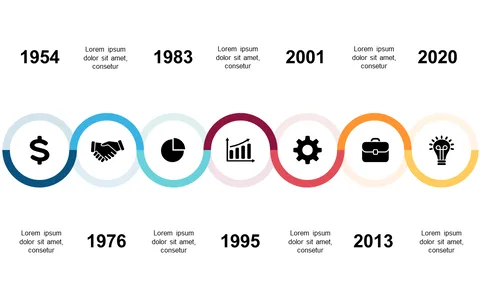
Chronologically Present Events with Icon Milestones

Product Description
When you’re tasked with presenting a series of events, it can be tricky to keep your audience engaged while ensuring they grasp the sequence. This timeline layout simplifies that challenge by clearly showcasing milestones with intuitive icons, making it easy for your listeners to follow along.
This slide is perfect for project managers delivering quarterly updates, marketing teams recapping a successful campaign, or educators reviewing historical events in class. Whether you’re in a team meeting, a client presentation, or a classroom setting, this timeline fits seamlessly into your narrative.
For just $0.99, you’ll receive an instant download that’s easy to edit in both PowerPoint and Google Slides. Customize the milestones to reflect your specific events and dates, making your presentation unique in just minutes.
$0.99 – Purchase Checkout
Added to cart