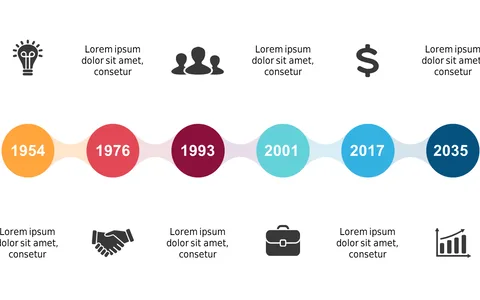
Present Key Milestones with Icon Timeline

Product Description
Showing the timeline of key milestones can be a challenge, especially when you want to make an impact. This layout presents significant events with icons and circular markers that visually illustrate your achievements over time, making it easy for your audience to understand your journey.
Executives, project coordinators, and team leaders will find this slide invaluable for quarterly reviews or strategic planning sessions. Whether you’re outlining historical progress or future objectives, this timeline slide makes your milestones stand out clearly and effectively.
At just $0.99, this slide is ready for instant download and can be edited in PowerPoint and Google Slides.
Easily customize the icons and text to reflect your projects, and you’ll be set to present in minutes.
$0.99 – Purchase Checkout
Added to cart