Highlight Trends with Gradient Line Chart
Product Description
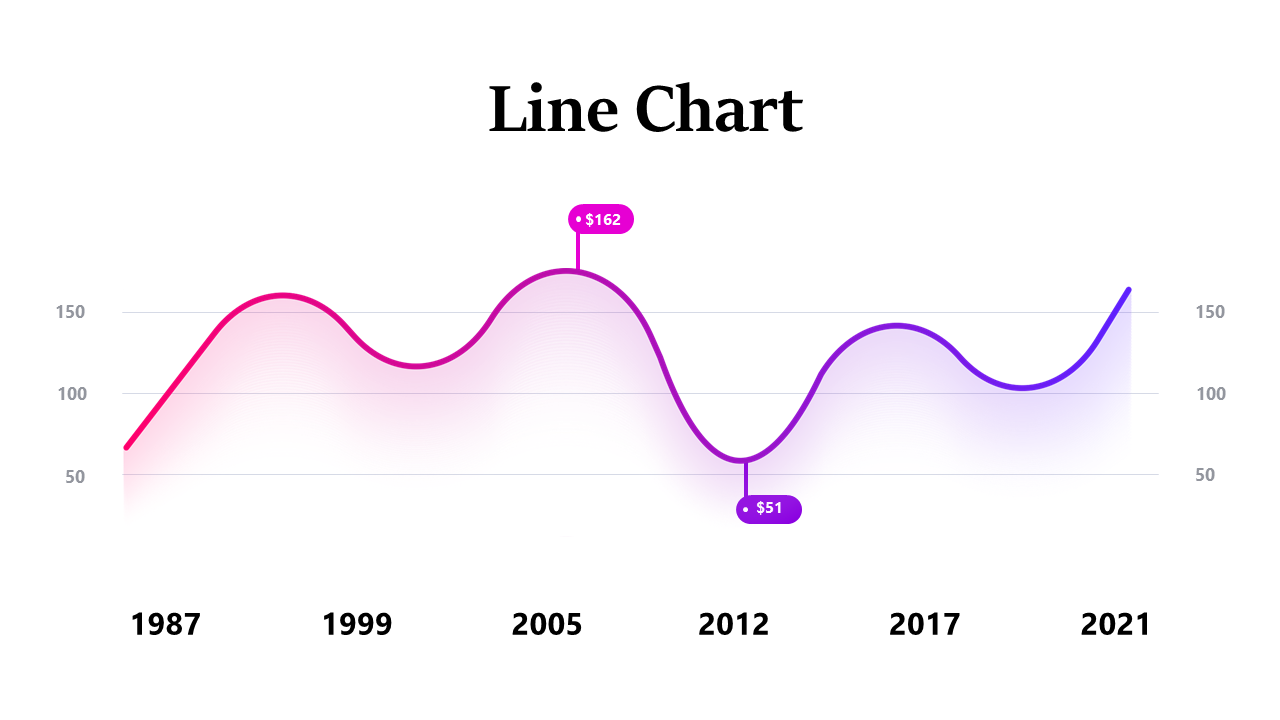
Communicating data trends clearly is key to making informed decisions, but it can often be a struggle. This gradient line chart slide allows you to illustrate your data effectively, ensuring that every point tells a part of your story. Clarity in your visual representation can enhance understanding and engagement.
Consider this slide for financial analysts presenting budget forecasts or marketers sharing customer engagement trends. It’s equally useful for project managers in weekly updates, helping to visualize project timelines and deliverables.
Your audience will appreciate the clarity it brings. Download this slide for just $0.99, and it’s ready for immediate use in PowerPoint or Google Slides. You can easily edit the chart to fit your specific needs, allowing you to create a professional presentation in no time.
$0.99 – Purchase Checkout
Added to cart







