Compare Weekly Performance with Editable Bar Chart
Product Description
Communicating weekly performance effectively can often feel like a daunting task. You want to ensure that your audience grasps the critical metrics without getting lost in the details.
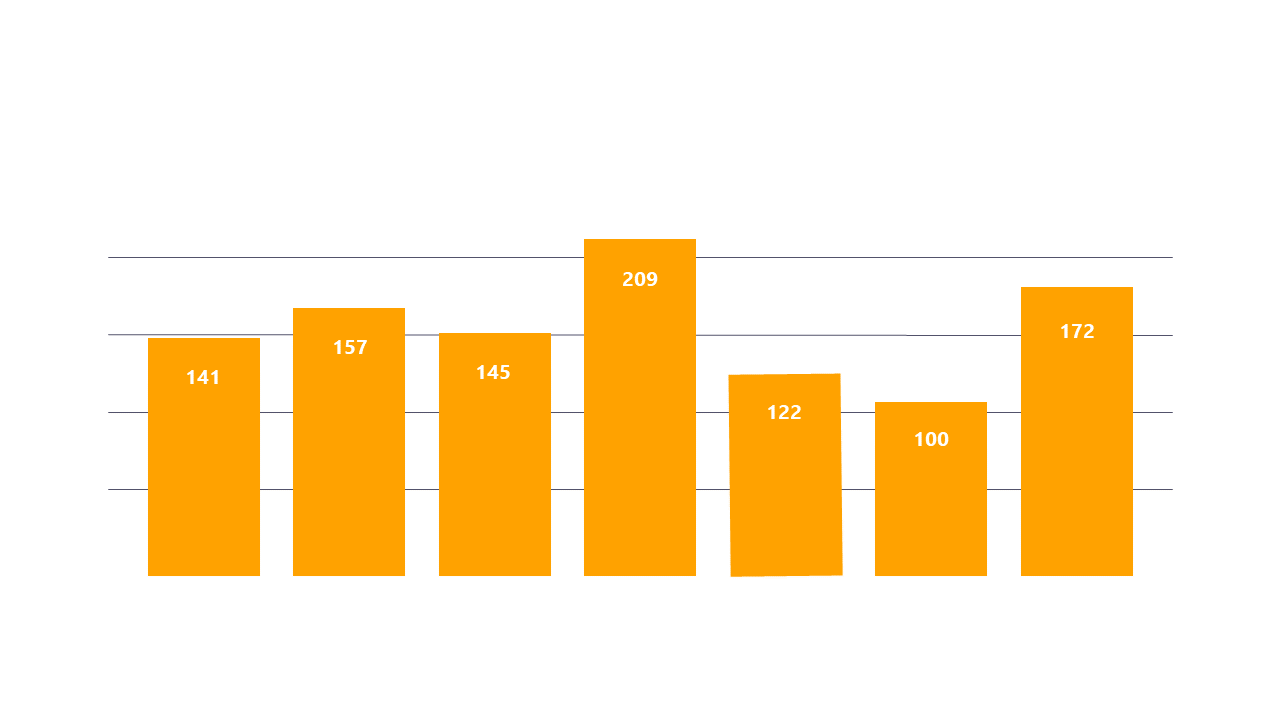
This editable bar chart helps you present performance data in a clear and compelling way, making it easy for all participants to understand the trends at a glance. Reporting managers and data analysts will find this slide particularly useful when presenting to executive teams or during departmental meetings. By clearly showcasing the performance metrics across multiple days, you can guide your audience’s attention to the information that truly matters, enhancing clarity in discussions about your team’s performance.
For just $0.99, you can easily download and edit this slide in both PowerPoint and Google Slides. It’s designed for quick customization, so you can focus on delivering insightful analysis without spending hours on design.
$0.99 – Purchase Checkout
Added to cart







