Highlight Annual Report Trends with Bar Chart
Product Description
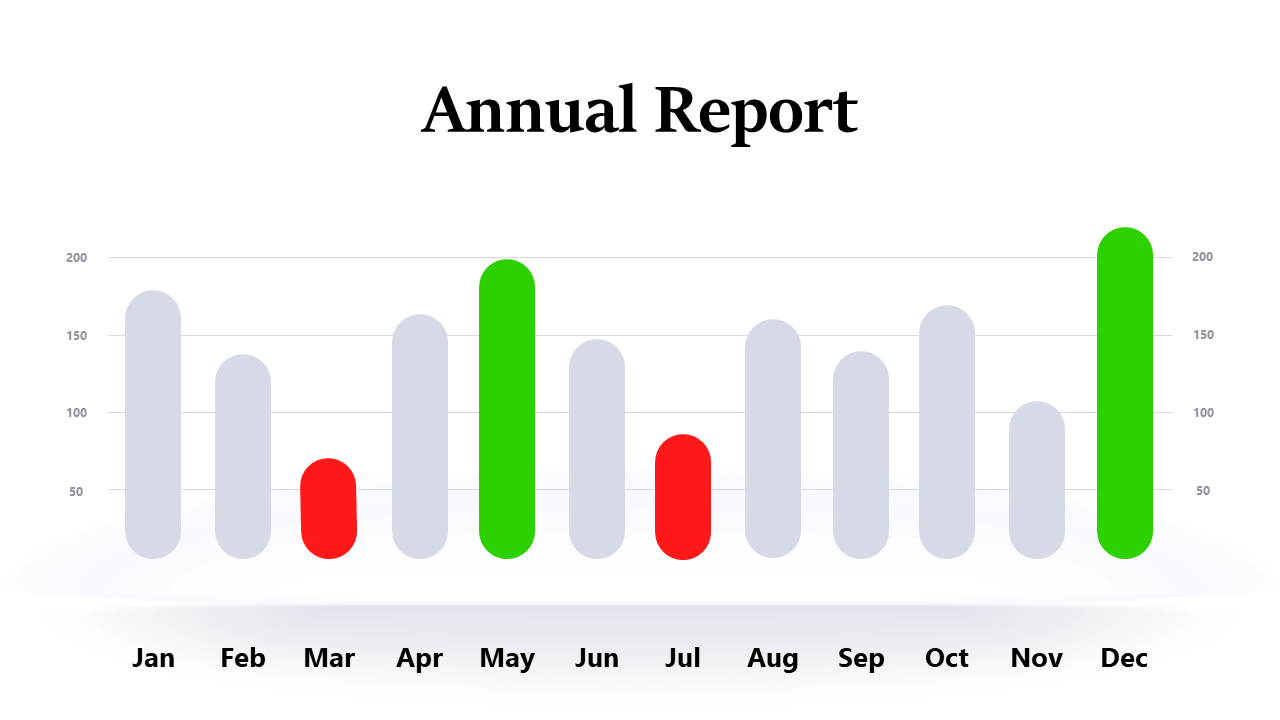
Highlighting trends in annual report data can often feel like a daunting task, especially when you want to draw attention to significant changes over time. A well-designed bar chart can transform raw data into clear insights, helping your audience quickly spot trends and achievements.
This layout is ideal for business analysts, finance directors, and executives presenting annual performance reviews or fiscal reports. Imagine sharing yearly sales data where you can easily point out growth periods or declines; this bar chart makes those insights pop.
For only $0.99, you can download this slide instantly and start customizing it to meet your needs. It’s fully editable for colors and data, and you can work with it in both PowerPoint and Google Slides in no time.
$0.99 – Purchase Checkout
Added to cart







