Sleek Line Chart for Data Trends Presentation
Product Description
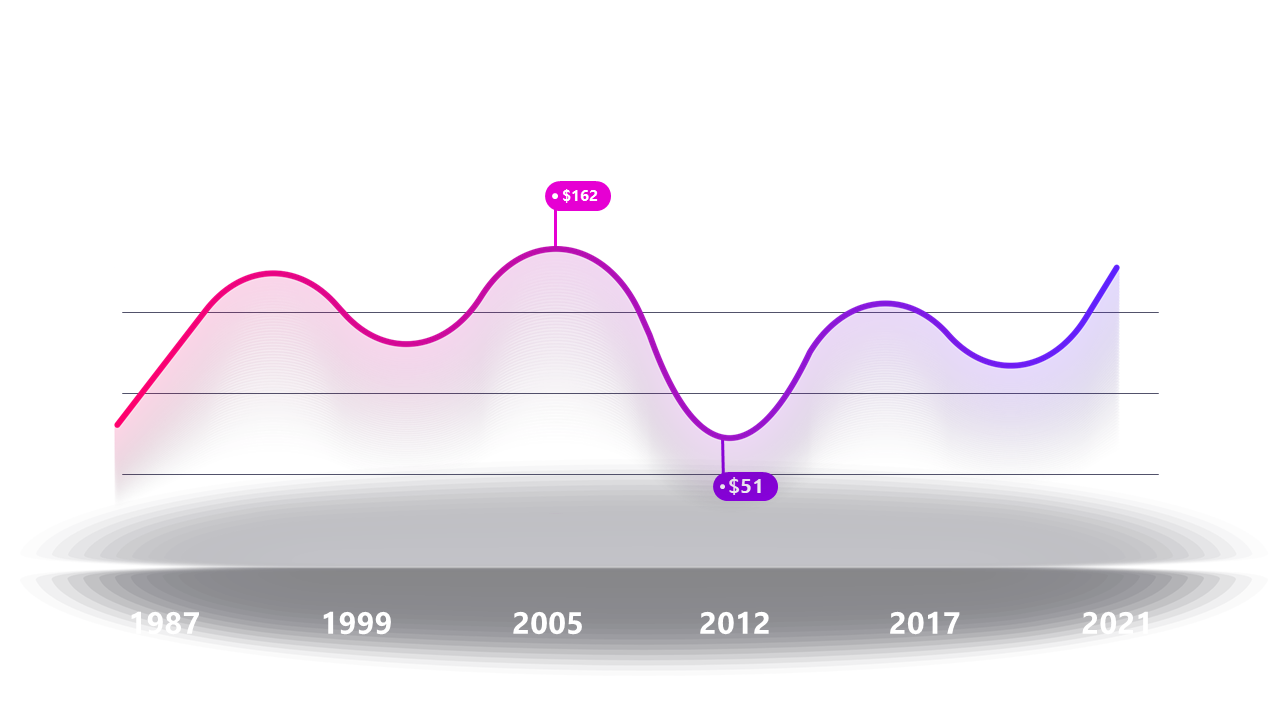
If you need to visualize data trends over time but want something stylish and modern, this sleek line chart fits the bill perfectly. It simplifies complex information, making it easier for your audience to grasp key performance indicators or historical data.
Financial analysts, product managers, and marketing specialists can use this chart in quarterly reports, performance updates, or sales presentations. The ability to customize the chart ensures that your data stands out while maintaining professionalism.
For only $0.99, this slide is available for immediate download and can be easily modified in PowerPoint and Google Slides. Grab it now and have it ready for your next meeting in just a few minutes!
$0.99 – Purchase Checkout
Added to cart







