Hourly Waterfall Chart for Time-Based Data
Product Description
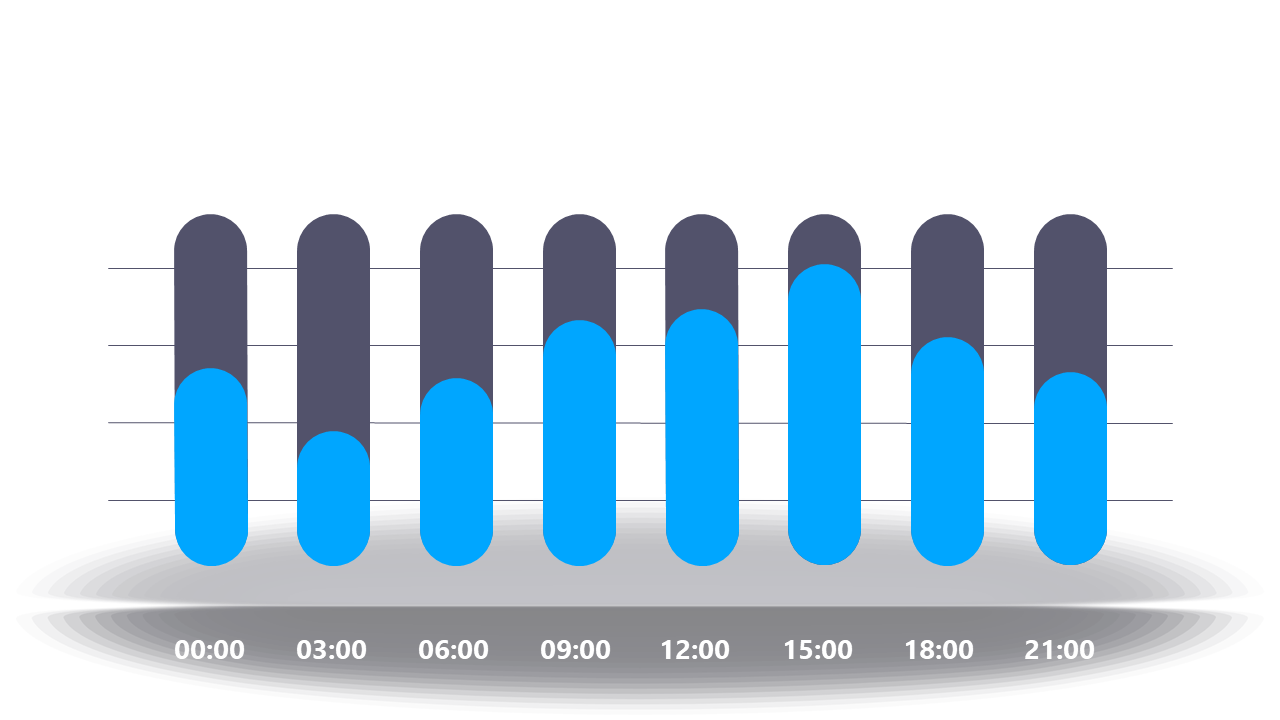
Understanding time-based data trends can be tricky, especially when you want to convey hourly fluctuations in a visually appealing manner. This Hourly Waterfall Chart allows you to illustrate how data changes over a 24-hour period, making it easy to detect patterns and anomalies.
This chart is particularly useful for operations managers, logistics coordinators, or any professionals analyzing time-sensitive data, such as website traffic or service response times. You can use it in daily standups or performance reviews to provide clarity to your audience.
For just $0.99, this slide is ready for immediate download and customization in PowerPoint and Google Slides. Don’t wait—get this slide now to enhance your presentations in no time!
$0.99 – Purchase Checkout
Added to cart







