Present Metrics with Colorful Bar Chart Design
Product Description
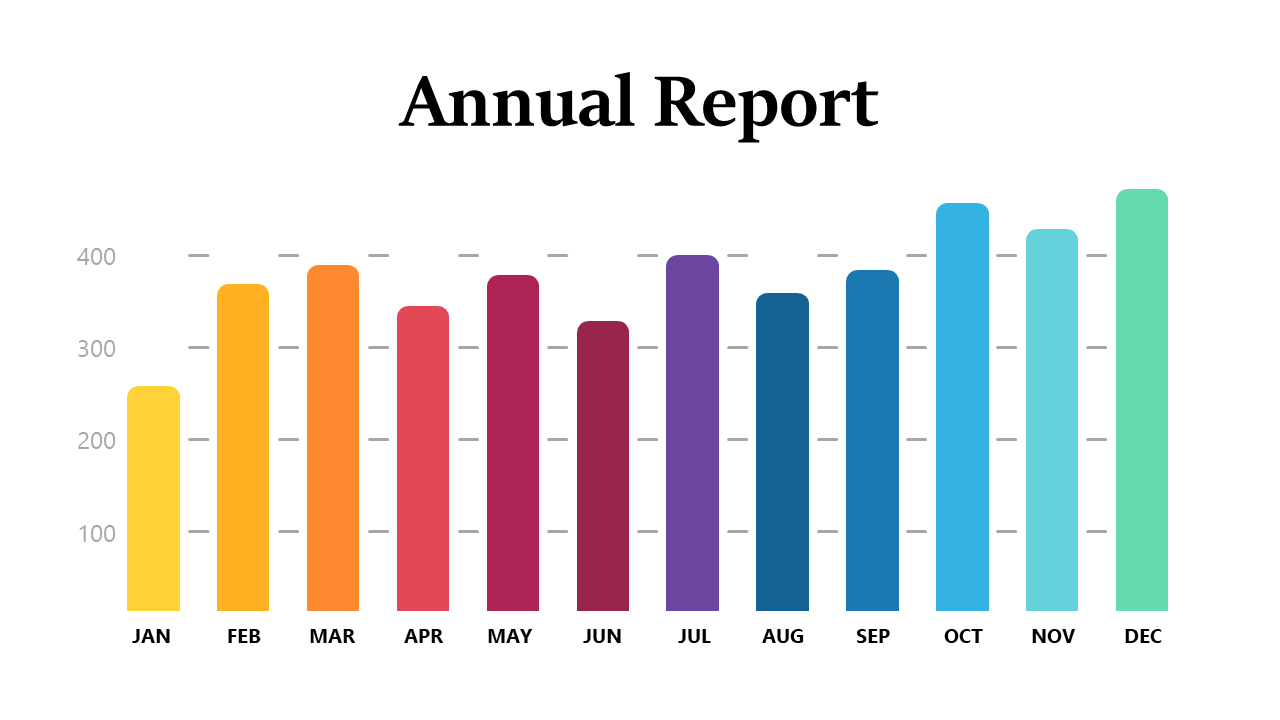
Capturing an audience’s attention during a metrics presentation is often a daunting task, especially with a sea of numbers. This engaging bar chart design features vibrant colors that draw the eye, transforming boring statistics into visually appealing information.
It makes sure your key data stands out, leaving a memorable impact. Data analysts, marketing specialists, and business executives will benefit from using this slide in team meetings or client briefings. By visualizing important metrics clearly, you can provide context and clarity, ensuring your audience understands the implications of the data you’re presenting.
For only $0.99, this slide can be downloaded instantly and is fully customizable in PowerPoint and Google Slides. You can quickly adjust the colors and data values to align with your brand or specific message, making it a hassle-free addition to your presentation toolkit.
$0.99 – Purchase Checkout
Added to cart







