Compare Metrics with Horizontal Bar Chart
Product Description
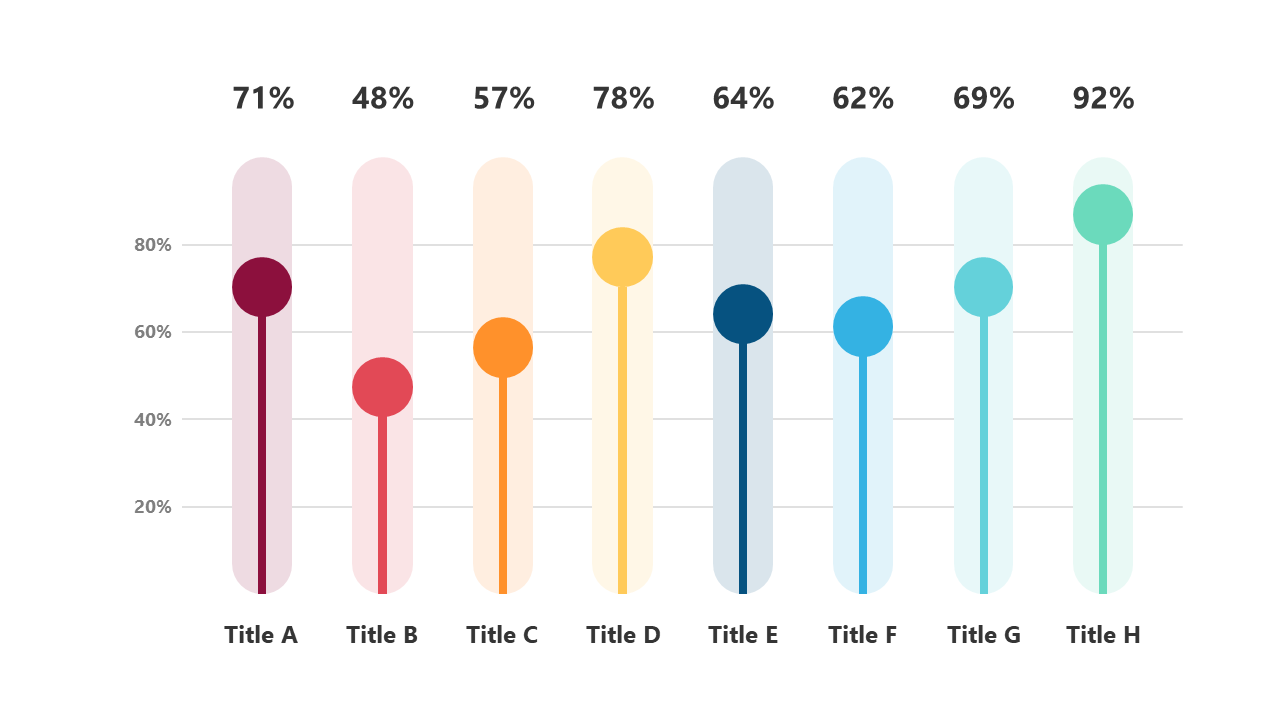
Presenting data clearly is crucial in avoiding confusion, especially when you’re dealing with multiple metrics. This horizontal bar chart provides a straightforward way to compare key indicators, making your insights easy to understand at a glance.
It’s a perfect tool to enhance your data storytelling. This slide is especially beneficial for data analysts interpreting sales figures, project managers assessing timelines, or executives comparing performance metrics. Use it in quarterly reviews, team updates, or strategic planning sessions where clarity in data presentation is essential.
For only $0.99, you can instantly download this editable slide, compatible with PowerPoint and Google Slides. Customize it to fit your data points, making it easy to create a polished and professional presentation in just a few minutes.
$0.99 – Purchase Checkout
Added to cart







