Showcase Key Metrics with Vertical Bar Chart Design
Product Description
In a world flooded with data, effectively showcasing key metrics can feel challenging, especially when you want to engage your audience without overwhelming them. A clear, vibrant presentation can make a significant difference in how your insights are received.
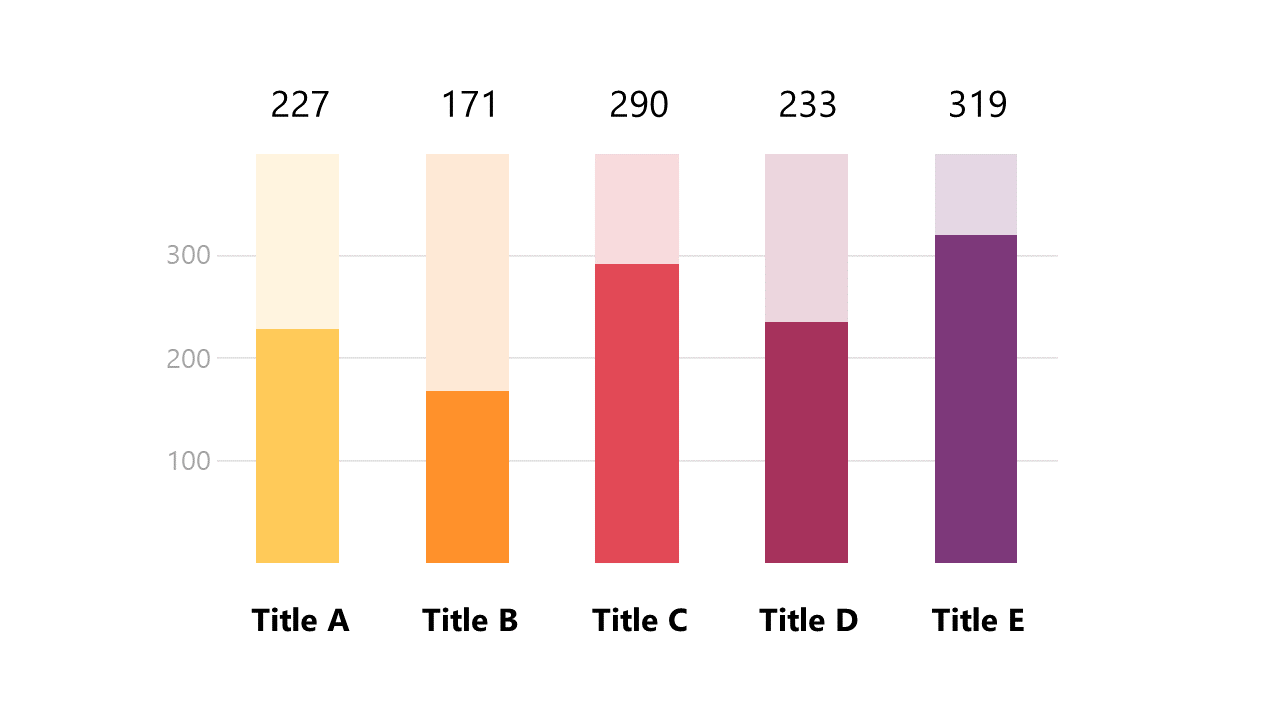
This vertical bar chart design is crafted to highlight your data in an engaging way, ensuring clarity and interest. Account managers presenting client results, executives sharing business performance in board meetings, or project leads analyzing resource allocation will benefit from this clearly designed chart. Its vibrant colors make comparisons straightforward, enhancing your audience’s understanding of your critical data points.
At just $0.99, this slide is available for immediate download and can be easily edited in PowerPoint and Google Slides. Tailor the chart to your specific metrics and designs in just moments, and be fully prepared for any presentation setting.
$0.99 – Purchase Checkout
Added to cart







