Track Growth Progress with 4-Step Linear Chart
Product Description
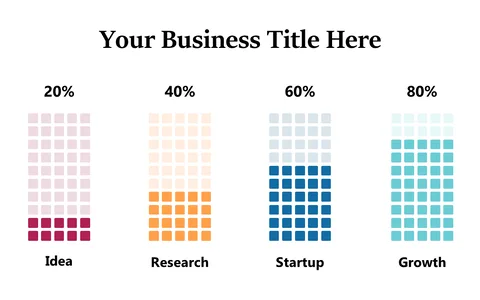
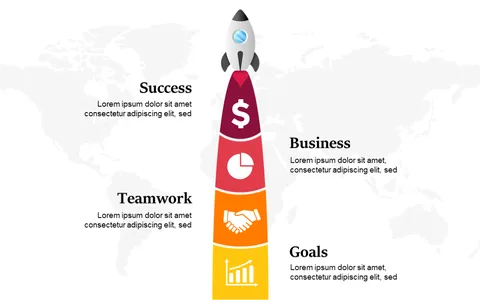
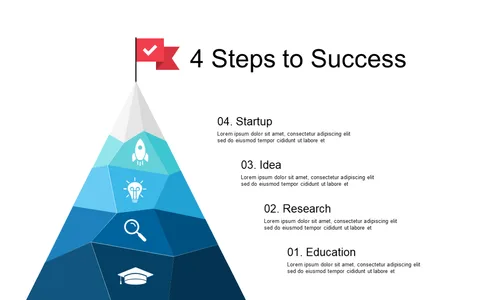
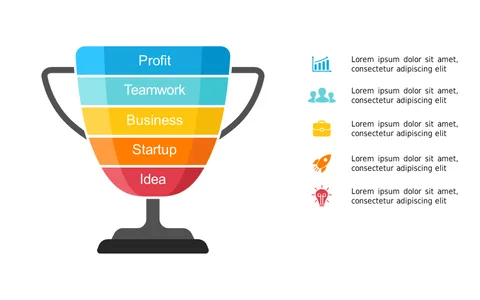
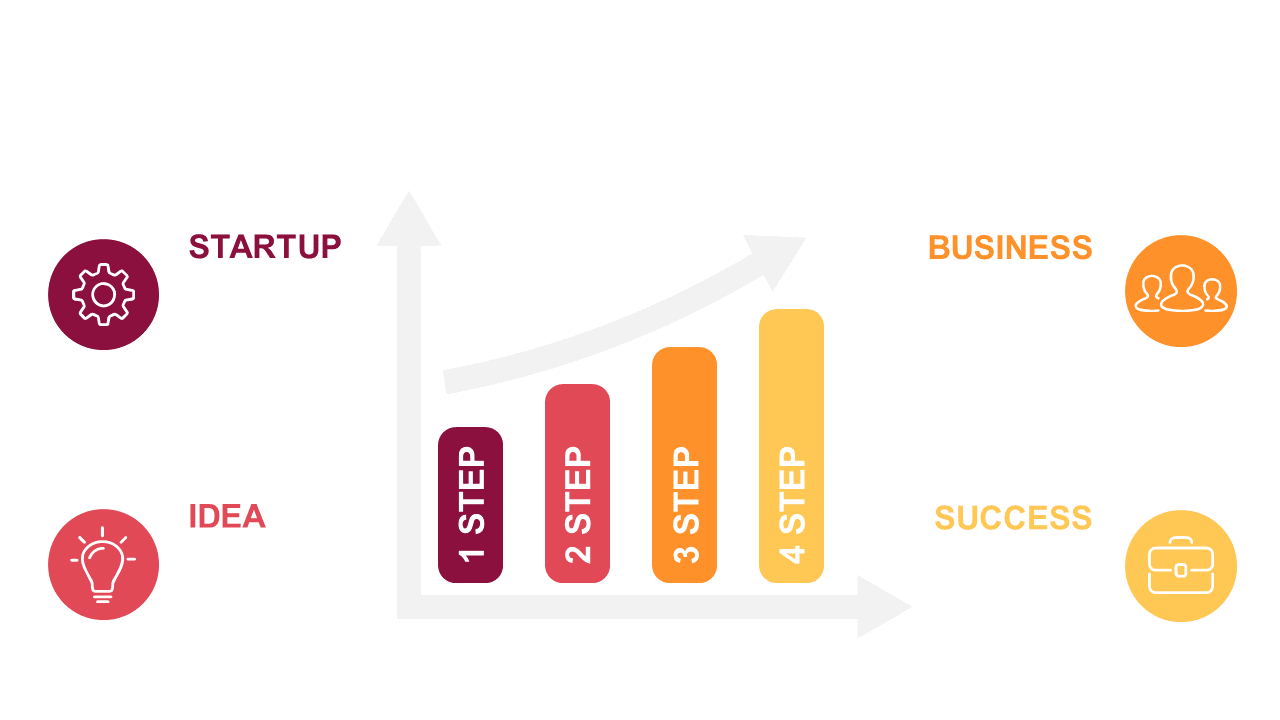
Tracking growth progress can become complex, especially when you need to present clear, actionable steps to your team or stakeholders. This linear chart clearly lays out four distinct stages from idea inception to business success, making it simple for everyone to visualize the journey. It eliminates confusion and enhances your communication.
This slide is particularly beneficial for project managers who are updating their teams on progress or entrepreneurs sharing their growth stories with investors. It can also be used by analysts in performance reviews or presentations to help clarify the company’s trajectory.
In any business environment, this chart serves as a practical tool for effective updates. For just $0.99, this slide is ready for instant download and easy editing in both PowerPoint and Google Slides. With a few clicks, you can adapt it to suit your presentation needs and be set in minutes.
$0.99 – Purchase Checkout
Added to cart