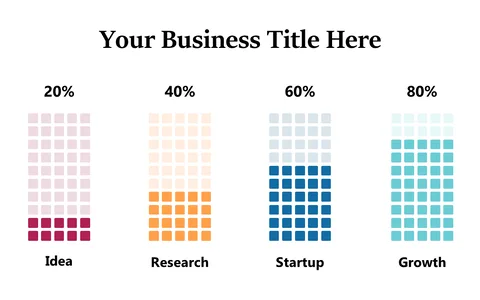
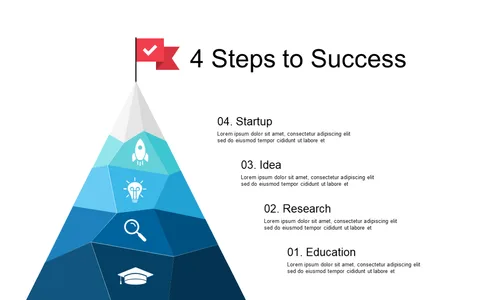
Map Business Growth with 4-Step Linear Chart
Product Description
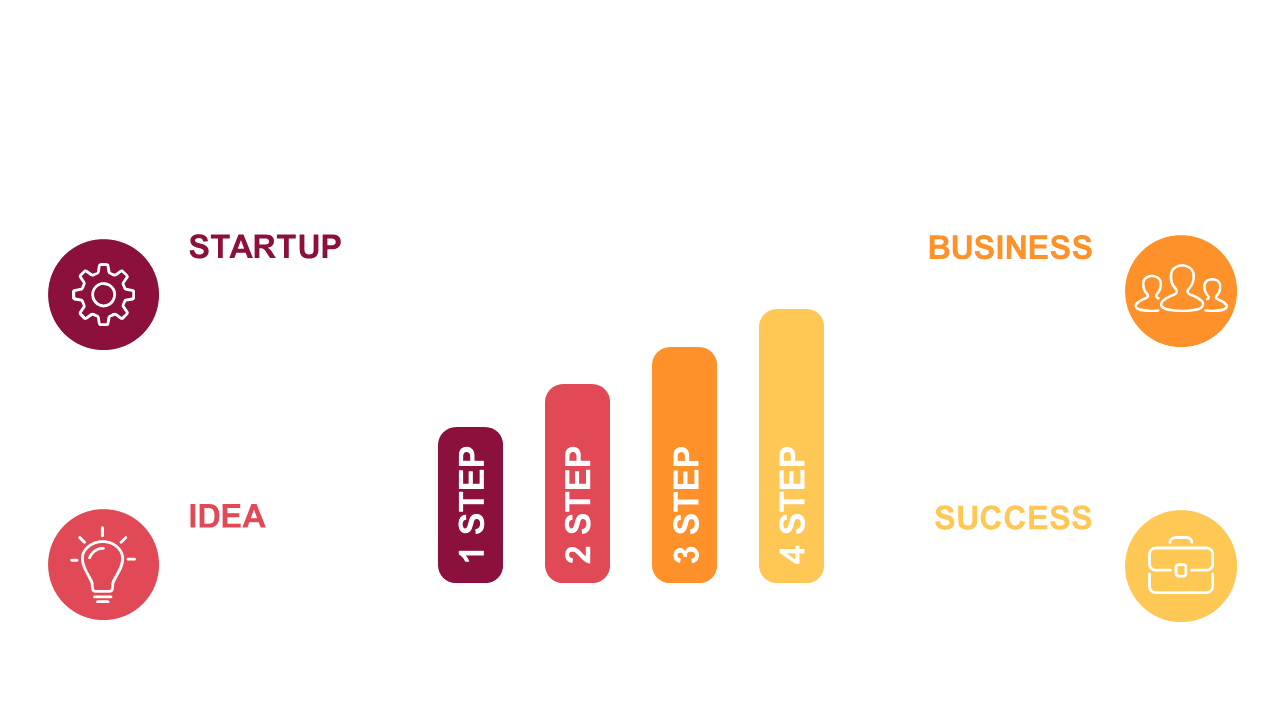
Communicating the stages of business growth can often feel overwhelming, particularly when trying to map out your journey from inception to success. This 4-step linear chart breaks down that complexity, offering a clear visual path to guide your audience through each stage. It’s an effective way to present your strategy and keep your viewers engaged.
Ideal for entrepreneurs in startup pitches or business consultants conducting strategic workshops, this slide helps articulate the growth process. It’s also valuable for team leads in sales meetings, showcasing how their strategies have progressed over time.
Whatever your role, this chart makes it easier to communicate growth effectively. For only $0.99, you can download this slide instantly and edit it in PowerPoint or Google Slides. Customizing is simple and quick, allowing you to mold it to your needs in just a few moments.
$0.99 – Purchase Checkout
Added to cart