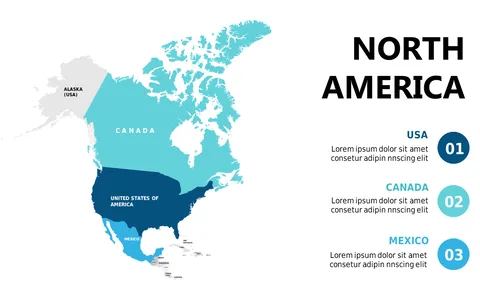
Detailed North America Map for Presentations

Product Description
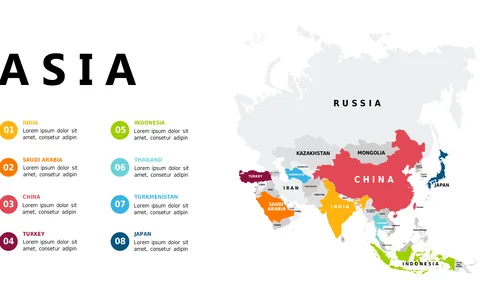
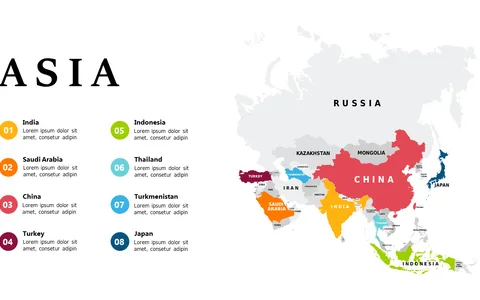
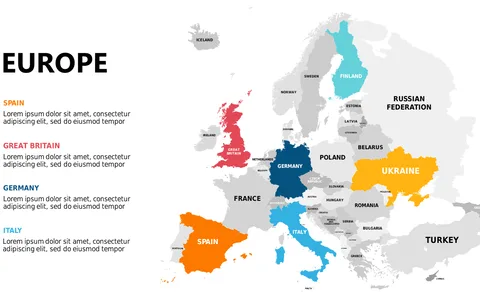
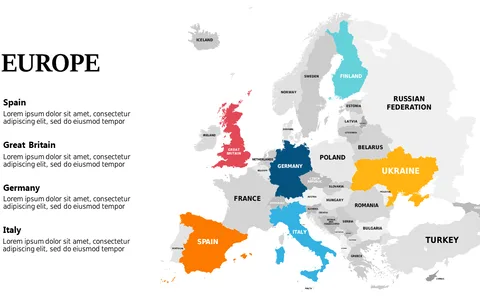
When you need to convey geographic trends or market potential in North America, clarity is key. A detailed map can make the difference between a confusing presentation and a compelling visual that speaks directly to your audience’s needs.
This slide ensures that your geographic data is presented in a clear and engaging manner. This slide is perfect for business analysts presenting market research, sales teams discussing territory allocations, or educators teaching geography. If you’re a project manager running discussions about regional expansion, this map provides the visual aid you need to make your points resonate with your audience.
For just $0.99, you can instantly download this slide and begin editing it in PowerPoint or Google Slides right away. Customize the colors and annotations to suit your presentation style and content, and have it ready in minutes.
$0.99 – Purchase Checkout
Added to cart