Visualize Events with Curved Timeline Layout

Product Description
When you’re trying to communicate a series of events or project phases, it can be tough to keep your audience engaged. A linear timeline often falls flat, leaving viewers disconnected from the progression of your work.
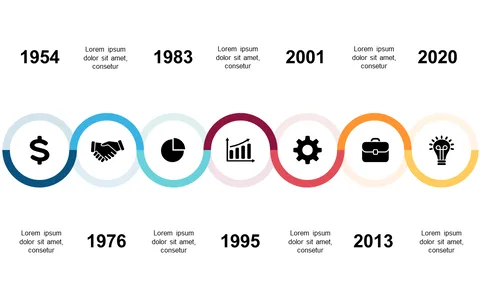
With a curved timeline layout, you can present milestones in a visually appealing way that makes your story come to life. This slide is a perfect fit for project managers detailing project timelines, marketers presenting campaign milestones, or educators outlining historical events. The dynamic design helps to visually differentiate between various years or themes, making it easier for your audience to follow along and understand the context.
For just $0.99, you can instantly download this slide and start customizing it to fit your needs. It’s easy to edit in both PowerPoint and Google Slides, allowing you to have your presentation ready in minutes.
$0.99 – Purchase Checkout
Added to cart