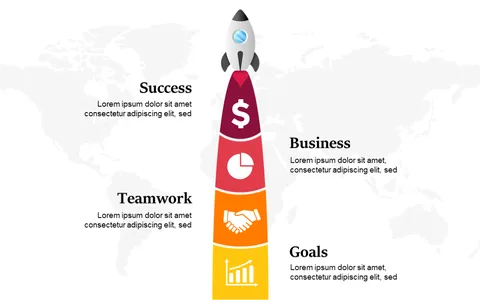
Present Business Growth Stages with Rocket Model

Product Description
Figuring out how to present complex business growth stages can be overwhelming. Instead of getting bogged down with numbers and charts, a visual representation can make your message clearer and more engaging for your audience. This rocket model helps you break down each growth phase in a fun and relatable way.
Entrepreneurs can use this slide during pitch meetings to illustrate their journey from concept to success. Investors could leverage it when evaluating startups, providing a clear overview of what to expect at each stage. Business strategists might find it invaluable during workshops or brainstorming sessions to foster discussions about growth trajectories.
For just $0.99, you gain access to an instantly downloadable slide that’s fully editable in PowerPoint and Google Slides.
You can customize it with your own text and images in minutes, making it a quick yet effective solution for your presentation needs.
$0.99 – Purchase Checkout
Added to cart