Visualize Sustainability Strategies with a Quadrant Diagram
Product Description
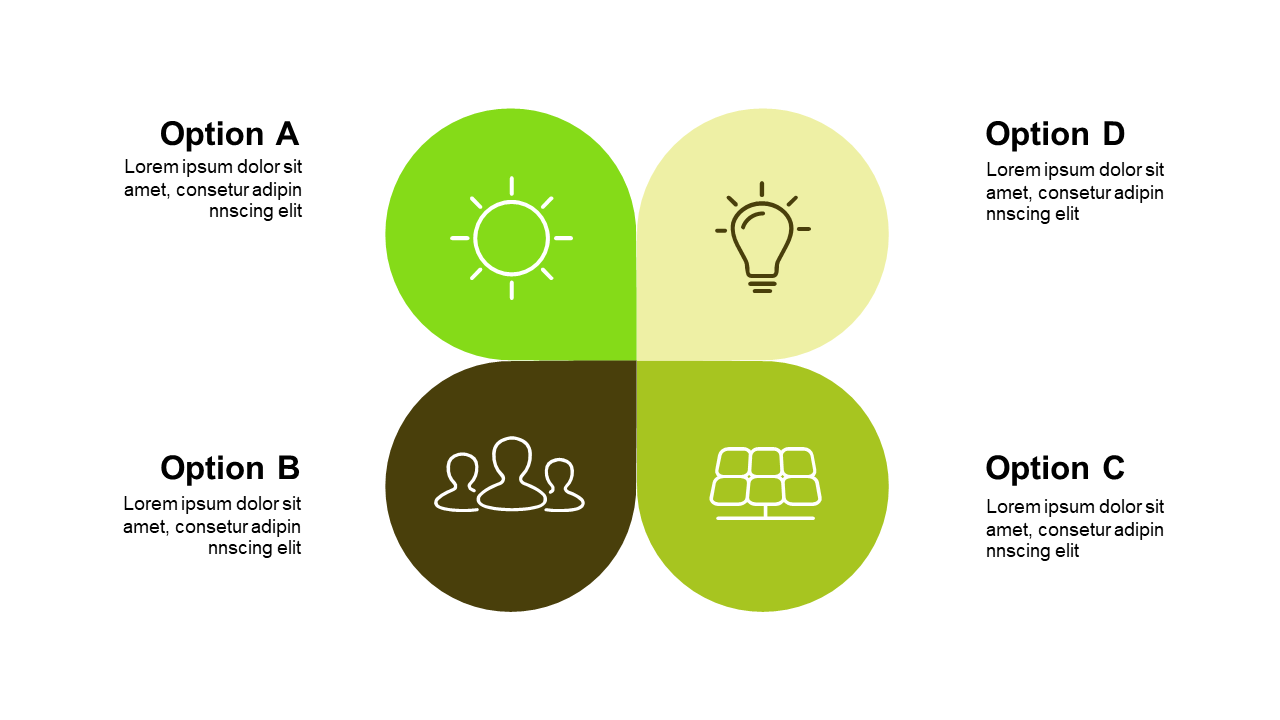
Sustainability strategies can often get lost in translation, especially when discussing multiple initiatives at once. You need a visual tool that can effectively showcase different approaches without overwhelming your audience. This quadrant diagram helps you achieve that by breaking down sustainability concepts into manageable segments.
Ideal for sustainability coordinators, environmental consultants, or marketing teams in eco-friendly industries, this slide is versatile for various settings. Use it in team workshops to brainstorm initiatives, or during client presentations to illustrate a comprehensive sustainability strategy.
At just $0.99, this slide is a smart investment in your presentation toolkit. You’ll receive it instantly and can
easily customize it in PowerPoint or Google Slides, ensuring it’s tailored to fit your specific needs in no time.
$0.99 – Purchase Checkout
Added to cart