Conduct Market Analysis with 4-Quadrant Layout
Product Description
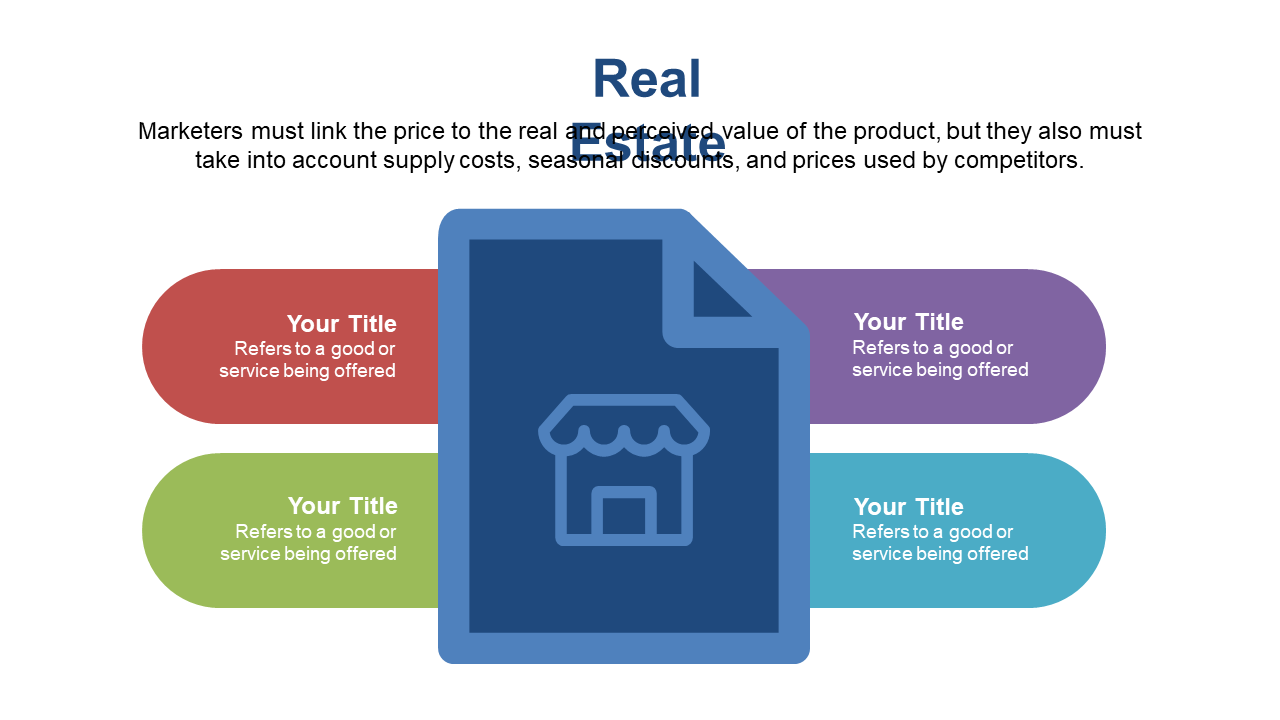
In the competitive market research landscape, presenting findings clearly can make or break your analysis. This 4-quadrant layout helps you dissect complex data into manageable parts, allowing your audience to grasp insights quickly.
It’s a powerful way to communicate your analysis without overwhelming your listeners. Market researchers, product managers, and business analysts will find this slide essential when conducting competitive analysis, consumer behavior studies, or trend assessments. Use it in strategy meetings, focus groups, or client presentations to convey your research effectively.
Available for just $0.99, you can download this slide instantly and edit it easily in PowerPoint or Google Slides. Customize it to match your project needs in minutes and deliver your insights with confidence.
$0.99 – Purchase Checkout
Added to cart







