Highlight Geographical Insights for Marketing
Product Description
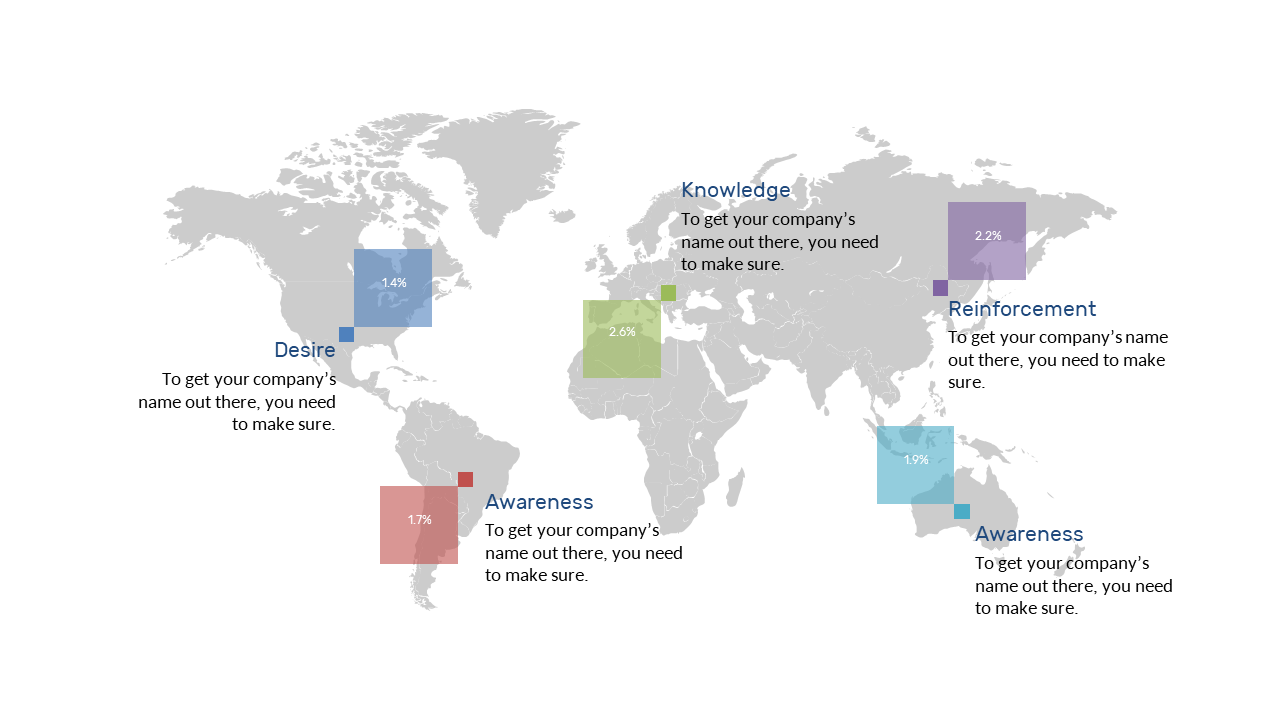
Making sense of geographical insights can be a headache, especially when trying to convey critical metrics to stakeholders. Without a clear visual representation, important details can get lost in translation, leaving your audience disengaged.
This slide helps you highlight key geographical metrics with clarity, making your insights more digestible. Ideal for marketing managers assessing regional performance, sales executives presenting to clients, or research analysts summarizing findings, this slide serves various roles across industries. Use it in quarterly business reviews, strategic planning meetings, or any context where geographical data plays a vital role in decision-making.
For only $0.99, you can download this slide and have it ready for customization in PowerPoint or Google Slides. Edit it to fit your specific data needs and create a compelling presentation that captures your audience’s attention.
$0.99 – Purchase Checkout
Added to cart