Analyze Sustainability with a Quadrant Diagram

Product Description
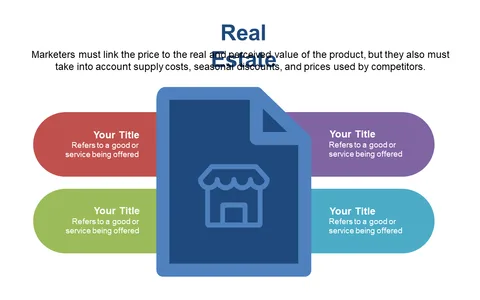
Presenting information on sustainability can often feel overwhelming, especially when trying to make comparisons clear. You need a way to break down complex ideas into relatable visuals, which is where this quadrant diagram shines. It allows you to depict various aspects of sustainability in an organized manner, helping your audience understand the nuances at a glance.
Marketers in the renewable energy sector, researchers analyzing carbon reduction strategies, and sustainability consultants can all benefit from this layout. Whether you’re in a team meeting discussing green technologies or preparing a report for a client, this diagram enables you to effectively communicate your findings and insights.
For just $0.99, this slide is an instant download that’s easily editable in PowerPoint and Google Slides.
You can customize colors and icons to fit your project, making it ready for your presentation in minutes.
$0.99 – Purchase Checkout
Added to cart