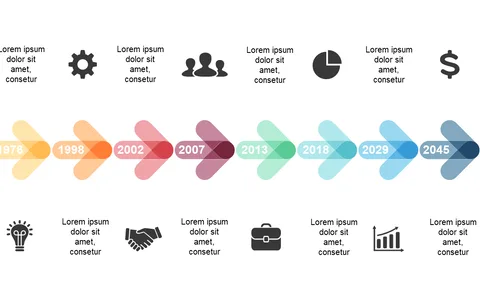
Engage with Event Timelines Using Bubble Elements
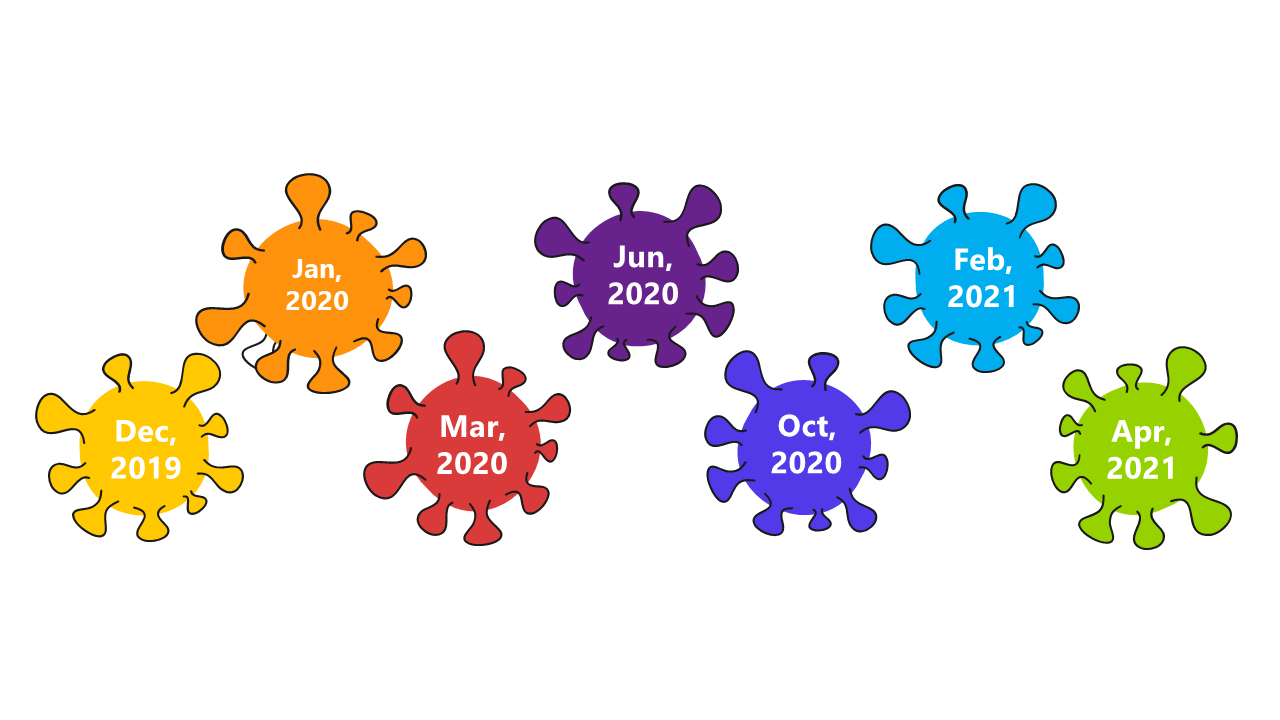
Product Description
Presenting a timeline of events can often feel dry and uninspiring, especially when you want to keep your audience engaged. This template introduces bubble elements that add visual interest, helping you tell your story more dynamically.
Whether you’re a project manager outlining key milestones, an event planner showcasing a series of preparations, or an educator discussing historical events, this slide fits seamlessly into your presentations. It’s a versatile choice for anyone needing a chronological visual that captivates attention.
Available for just $0.99, this slide can be instantly downloaded and personalized in both PowerPoint and Google Slides. Editing your dates and colors is simple, allowing you to make adjustments in mere minutes.
$0.99 – Purchase Checkout
Added to cart