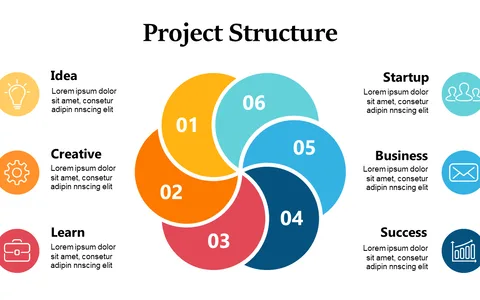
Illustrate Cyclical Processes with Colorful Circular Diagram

Product Description
In the fast-paced world of operations, articulating cyclical processes can be challenging. A visually appealing diagram makes it easier to demonstrate how ongoing cycles operate, keeping your audience engaged and informed.
Without a clear layout, you risk losing your audience’s attention when explaining complex workflows. This Colorful Circular Diagram is perfect for operations managers illustrating supply chain processes, project leaders showcasing iterative development cycles, or HR professionals outlining onboarding steps. You can use it in team meetings, training sessions, or reports to convey information in an easily digestible format.
For only $0.99, you can download this eye-catching slide immediately. It’s fully customizable in PowerPoint and Google Slides, allowing for quick edits to tailor the design and content to your specific needs.
$0.99 – Purchase Checkout
Added to cart