Visualize 6-Step Processes for Strategic Planning
Product Description
Conveying multiple steps in a strategic planning process can often lead to confusion and disengagement. If each phase isn’t clearly depicted, your audience might miss key points.
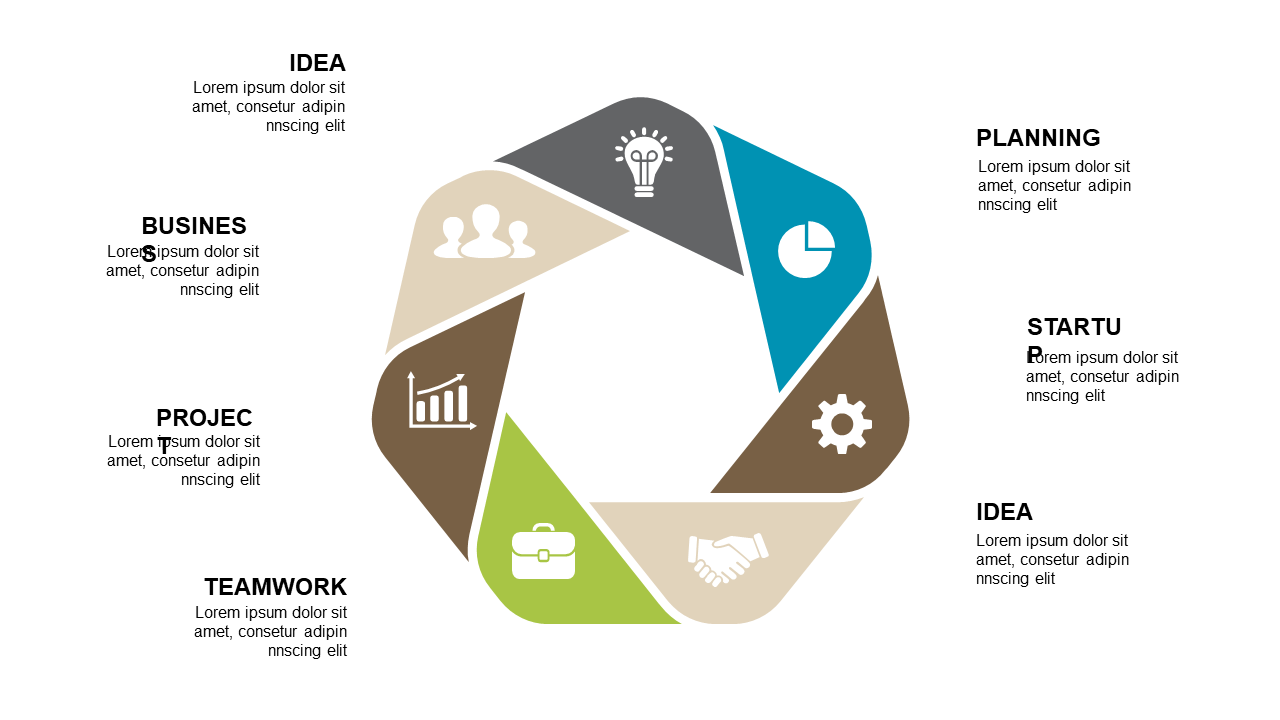
This circular process diagram breaks down six phases into distinct segments, allowing for clear visualization of complex ideas. Perfect for project managers outlining strategic initiatives, business consultants discussing frameworks, or team leaders guiding discussions on future goals, this slide is tailored for collaborative environments. It brings clarity to your strategic conversations.
Download this slide instantly for just $0.99 and start editing right away in PowerPoint or Google Slides. Customize each segment to reflect your specific phases and effectively communicate your strategy with ease and professionalism.
$0.99 – Purchase Checkout
Added to cart







