Engage Audiences with 7-Step Cycle Diagram V2
Product Description
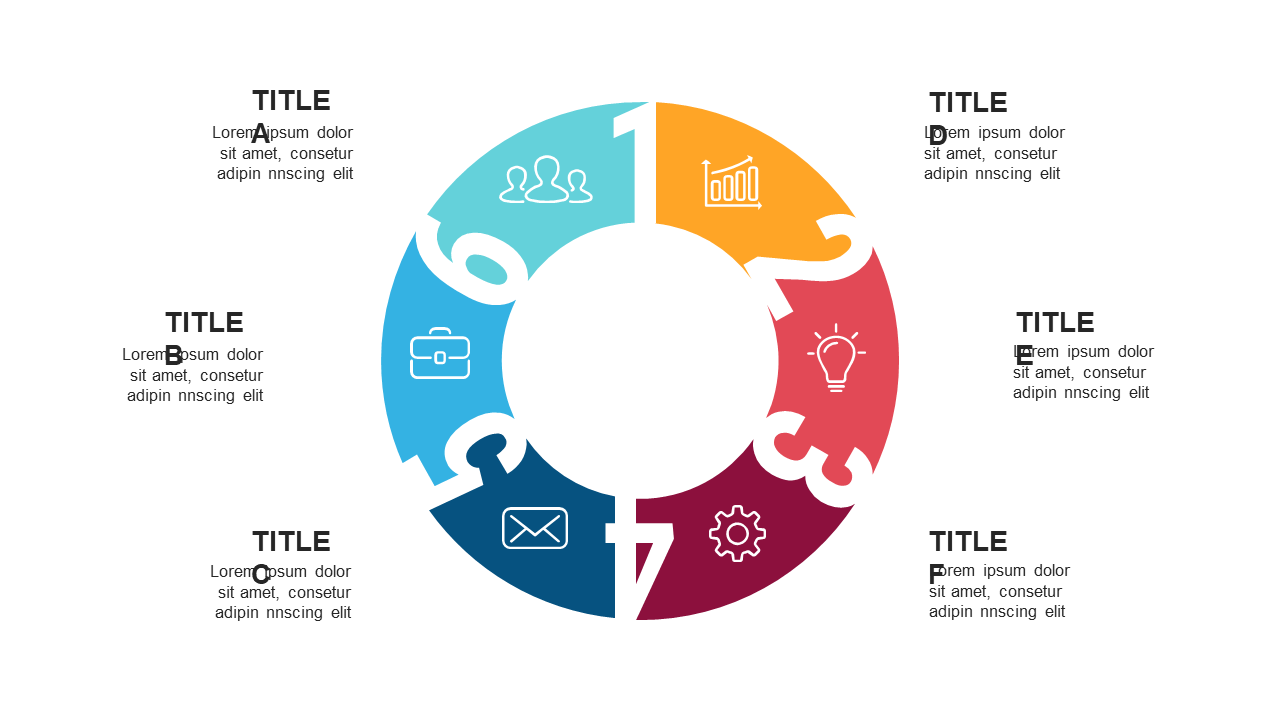
Communicating workflows clearly can often feel like navigating a maze, especially when dealing with complicated processes. The 7-step cycle diagram helps you break down those complexities into a straightforward visual that your audience will appreciate.
Its engaging layout makes even the most intricate workflows easy to understand. This slide is perfect for project managers, marketing coordinators, or operations directors looking to present processes in meetings, workshops, or training sessions. Use it to illustrate everything from project milestones to marketing funnels, ensuring your audience grasps the entire workflow at a glance.
At just $0.99, this slide is available for instant download and is fully editable in both PowerPoint and Google Slides. You can tailor it to fit your presentation style in no time, making it an essential tool for your next meeting.
$0.99 – Purchase Checkout
Added to cart







