Visualize Business Processes with Hexagonal Cycle V5
Product Description
Translating complex workflows into understandable visuals can be daunting for many operations managers. A clear representation of processes helps foster better communication and understanding within teams.
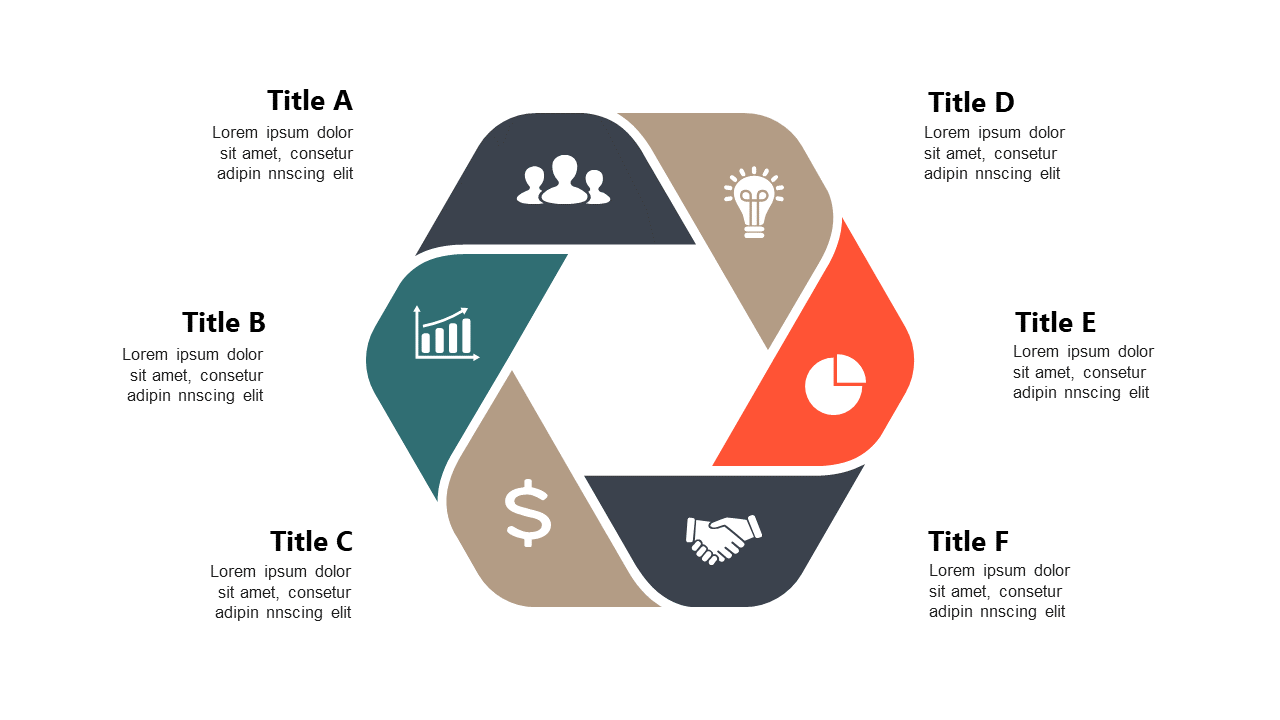
This hexagonal cycle diagram is designed to break down intricate business processes into easily digestible segments with relevant icons. You can use this slide during team meetings, training sessions, or process improvement workshops to illustrate workflows effectively. It’s perfect for operations managers, project coordinators, and quality assurance teams looking to enhance transparency and efficiency in their communication.
Available for just $0.99, this slide is ready for you to download instantly. You can edit it easily in PowerPoint and Google Slides to align it with your specific processes in just minutes.
$0.99 – Purchase Checkout
Added to cart







