Visualize Workflows with Colorful Circular Diagram
Product Description
In a fast-paced work environment, delivering complex workflows clearly can be a daunting task. A simple text explanation often falls flat, failing to engage your audience.
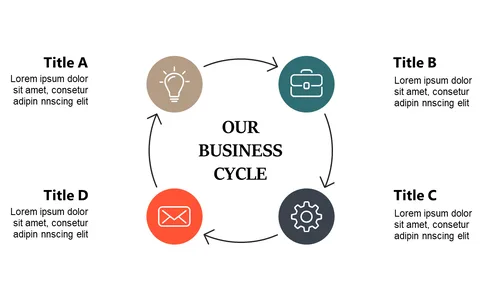
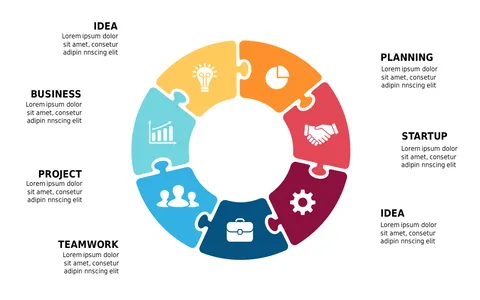
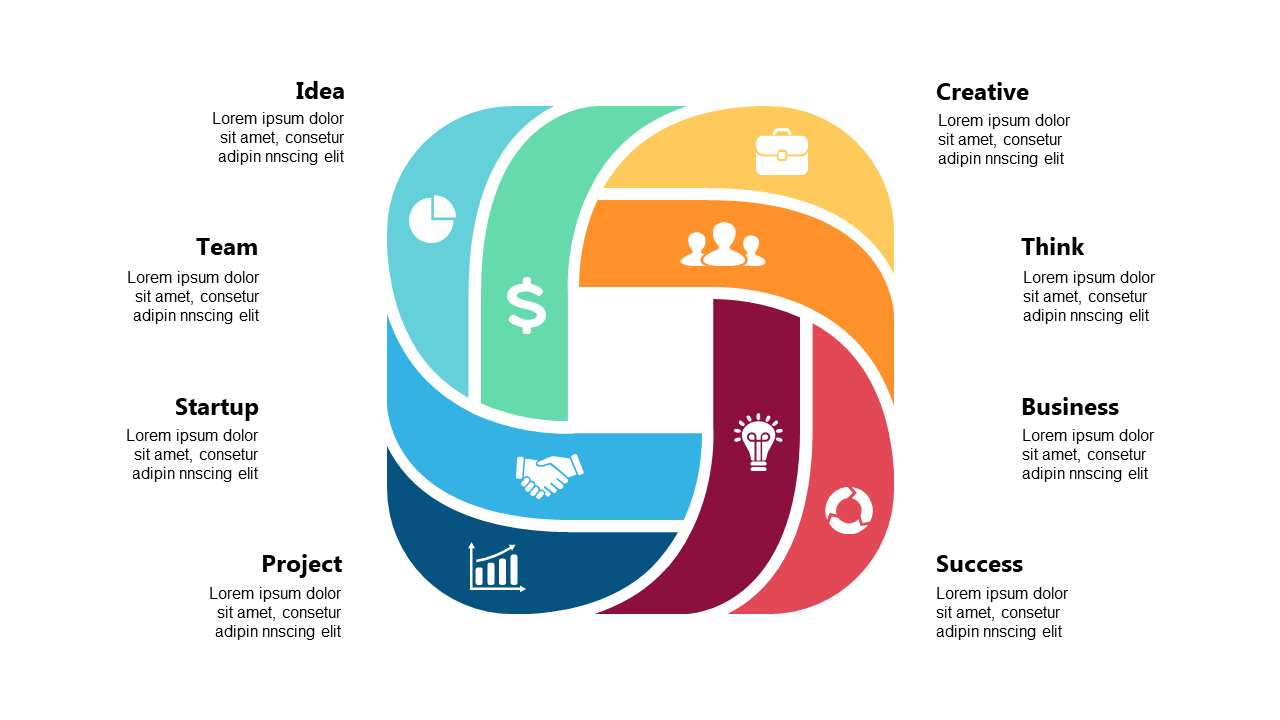
This colorful circular diagram offers a visually appealing way to represent processes, making it easier for your audience to follow along and absorb the information. This slide is especially beneficial for operations managers conducting process improvement meetings or sales teams mapping out customer journeys. It can help professionals across various industries illustrate workflows in a dynamic manner, whether in training sessions or project updates.
You can grab this slide for only $0.99, and it’s ready for instant download. Edit it easily in PowerPoint and Google Slides, allowing you to enhance your presentations quickly and effectively.
$0.99 – Purchase Checkout
Added to cart