Present Strategies with Engaging Circular Diagram

Product Description
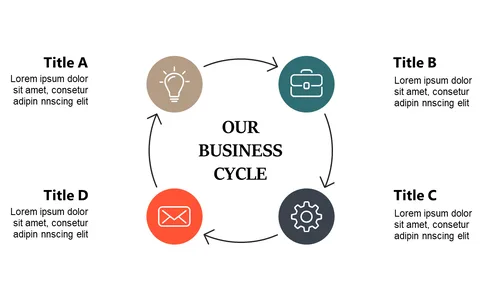
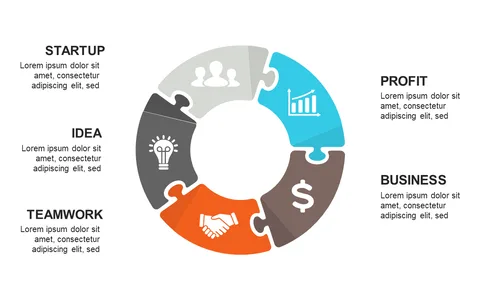
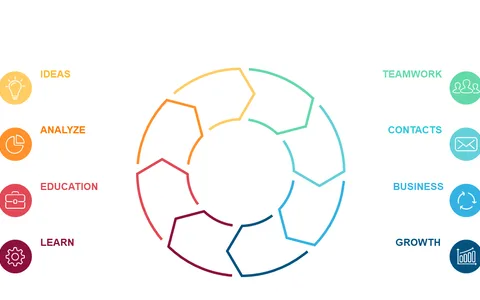
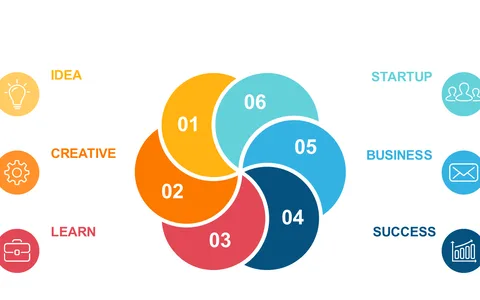
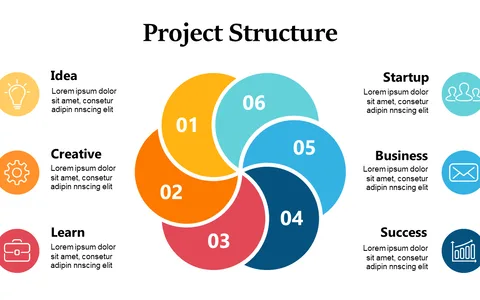
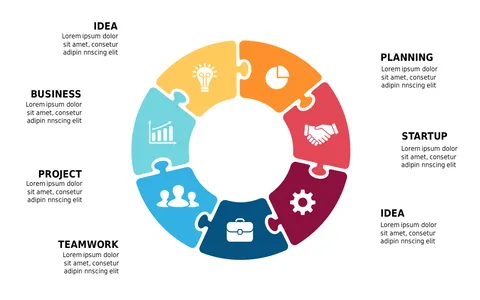
Consultants often face the challenge of making complex strategies engaging for their clients. This engaging circular diagram is specifically designed to help you illustrate processes effectively, with vibrant colors and distinct sections that draw the eye.
It transforms dense information into an accessible and lively format, ensuring clarity and retention. Whether you’re presenting a marketing strategy to a small business owner or detailing a financial plan in a corporate setting, this slide is your go-to visual aid. It’s perfect for client meetings, workshops, or strategy sessions where engaging visuals can make all the difference in conveying your message.
At just $0.99, this slide is available for instant download, allowing you to quickly integrate it into your presentation. It’s fully editable in PowerPoint and Google Slides, so you can tailor it to fit your specific content and style.
$0.99 – Purchase Checkout
Added to cart