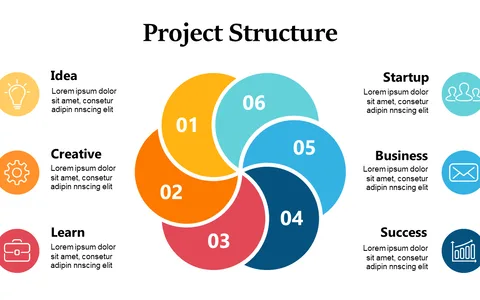
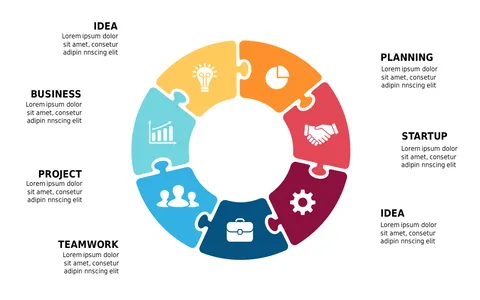
Engage Teams with Colorful Circular Process Diagram
Product Description
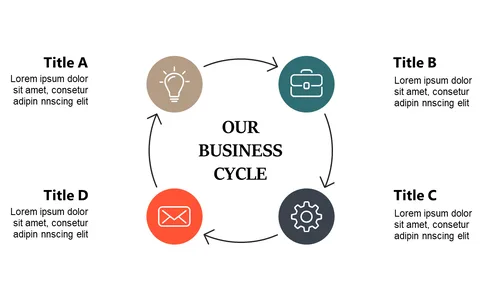
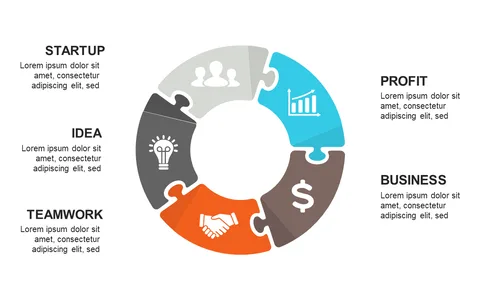
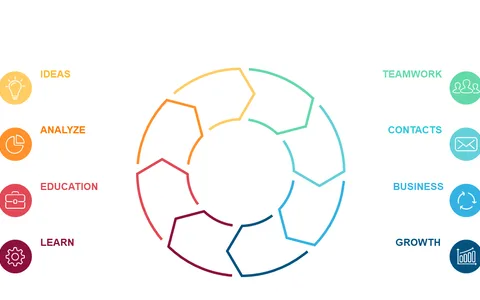
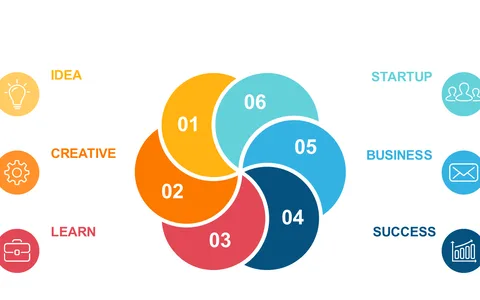
Engaging your audience can be tough when presenting complex workflows, especially if they become overwhelmed by the information. This colorful circular process diagram not only makes the data more digestible but also captures attention, turning tedious points into a visually stimulating experience.
It helps ensure your message is communicated effectively. Ideal for graphic designers during creative brainstorming sessions or human resource professionals explaining onboarding processes, this slide fits a variety of settings. Use it in team meetings, training sessions, or project presentations where visual clarity is crucial to maintaining interest and focus.
For only $0.99, you can download this slide instantly. Edit it effortlessly in PowerPoint or Google Slides to suit your needs, making it a quick solution to enhance your presentations without the hassle.
$0.99 – Purchase Checkout
Added to cart