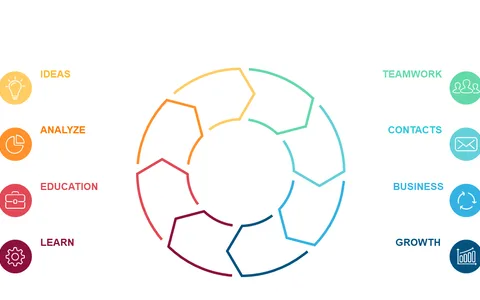
Engage Your Audience with an 8-Segment Process Cycle
Product Description
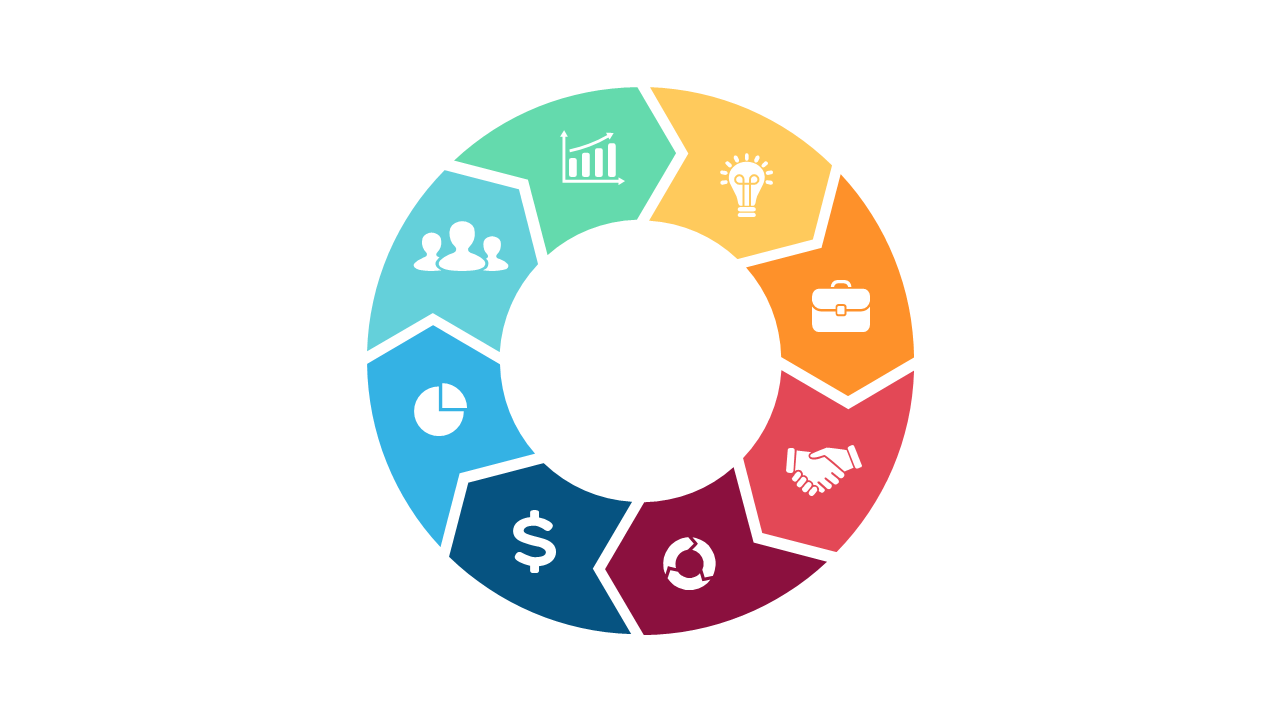
It’s often a challenge to capture your audience’s attention, especially when presenting complicated processes. This 8-segment process cycle slide makes it easy to represent interconnected ideas in a visually stimulating format, ensuring that your key points stand out clearly.
This slide is ideal for project coordinators outlining project phases or finance analysts discussing budget allocation cycles. It’s also perfect for trainers conducting workshops, allowing them to present various topics in a structured way that’s easy to follow.
For just $0.99, you can download this slide instantly and edit it to fit your style in PowerPoint or Google Slides. You’ll be ready to present in minutes, keeping your audience engaged and informed throughout your presentation.
$0.99 – Purchase Checkout
Added to cart