Visualize Business Concepts with an 8-Section Diagram
Product Description
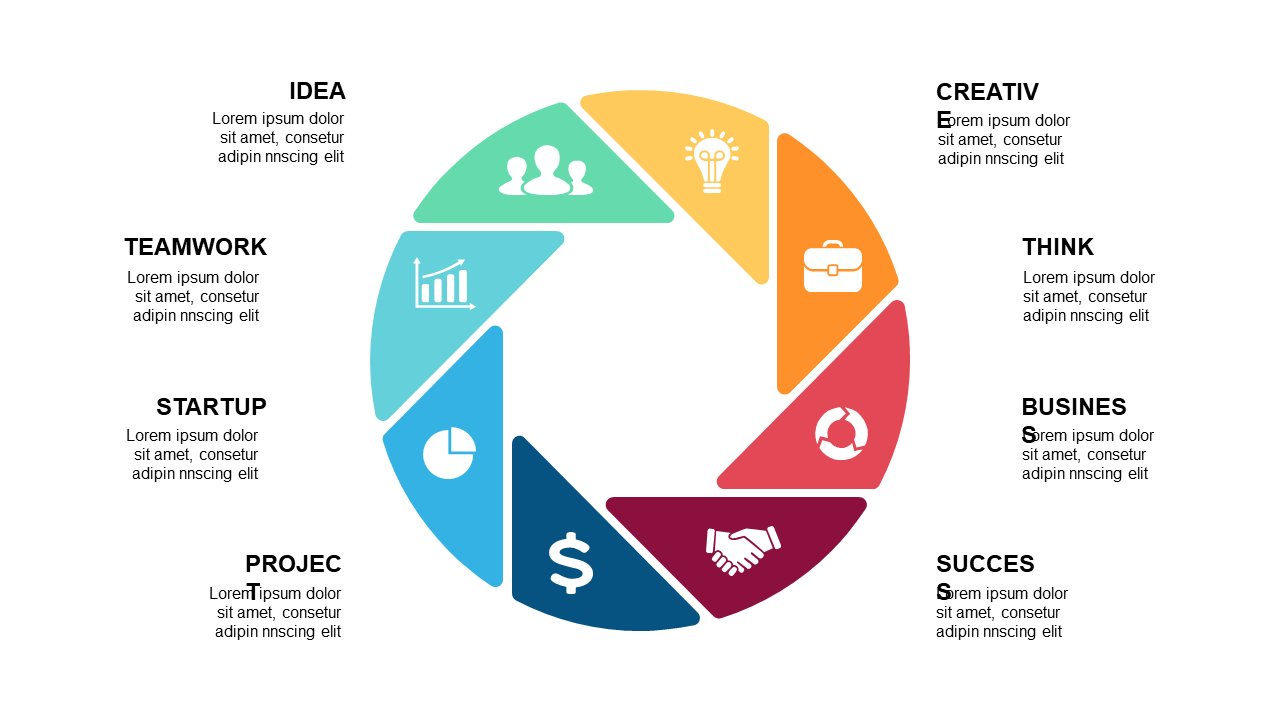
Communicating complex concepts can often feel overwhelming, especially in fast-paced environments where clarity is crucial. This visually engaging eight-section diagram simplifies multifaceted ideas, helping you present your strategies without losing your audience’s interest.
The distinct icons in each section make it easy to convey unique aspects of your message. Strategy managers, business development professionals, and consultants will find this slide especially useful for presenting strategic plans, market analyses, or competitive landscapes. Use this slide during team meetings, workshops, or client presentations to ensure everyone grasps the complexities you are discussing.
At just $0.99, this slide is ready for instant download and can be easily modified in PowerPoint or Google Slides. You’ll be well-equipped to add clarity to your presentations in no time.
$0.99 – Purchase Checkout
Added to cart







