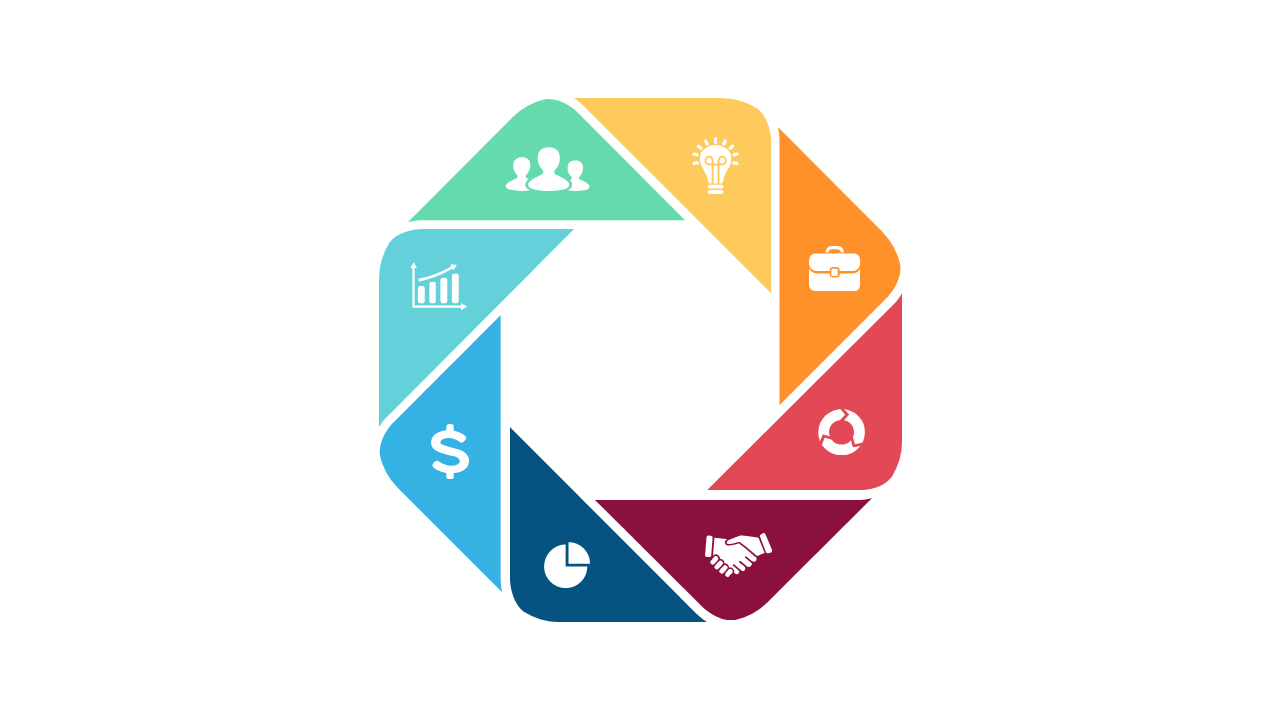
Engage Your Audience with an 8-Section Diagram
Product Description
Engaging your audience with intricate concepts can be a real challenge in any presentation. This 8-section diagram provides a visually appealing way to simplify your message, ensuring that your audience remains captivated while grasping the necessary details.
This slide is especially useful for corporate trainers delivering new strategies, consultants explaining frameworks, or team leaders discussing project phases. Whether in workshops or client-facing meetings, this diagram helps illustrate your points effectively.
At just $0.99, you can download this slide immediately and edit it in either PowerPoint or Google Slides. Make your presentations shine with this engaging design that’s just minutes away.
$0.99 – Purchase Checkout
Added to cart







