Showcase Business Concepts with Circular Icons V8
Product Description
Clearly presenting complex ideas can be a real struggle, especially when you’re trying to engage your audience. Many strategy managers feel overwhelmed when they need to convey intricate business concepts in meetings.
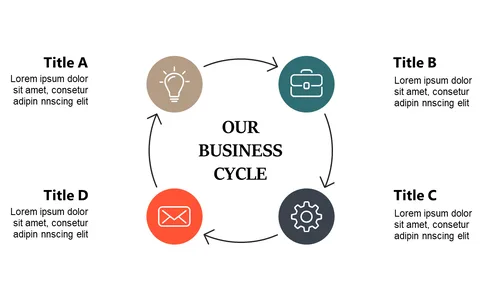
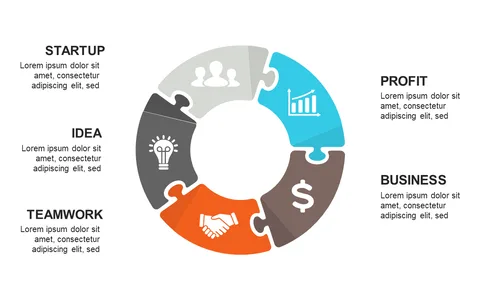
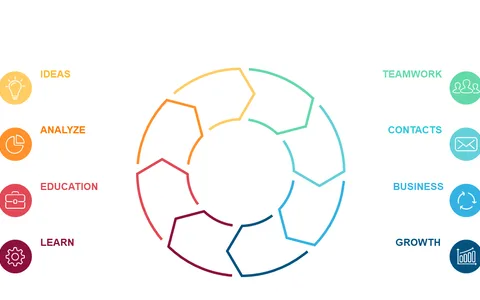
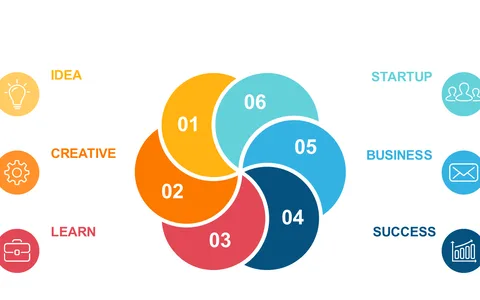
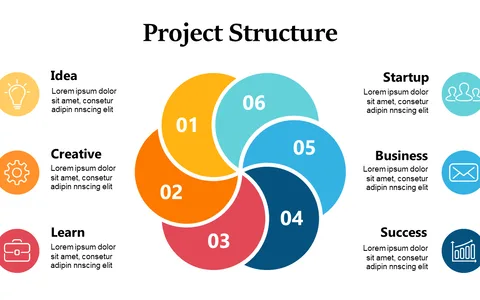
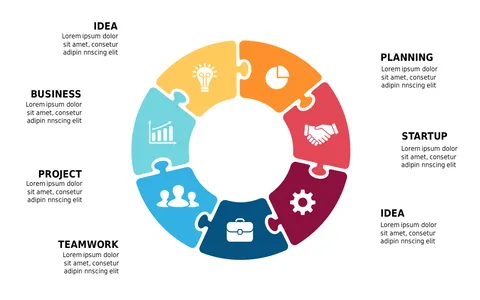
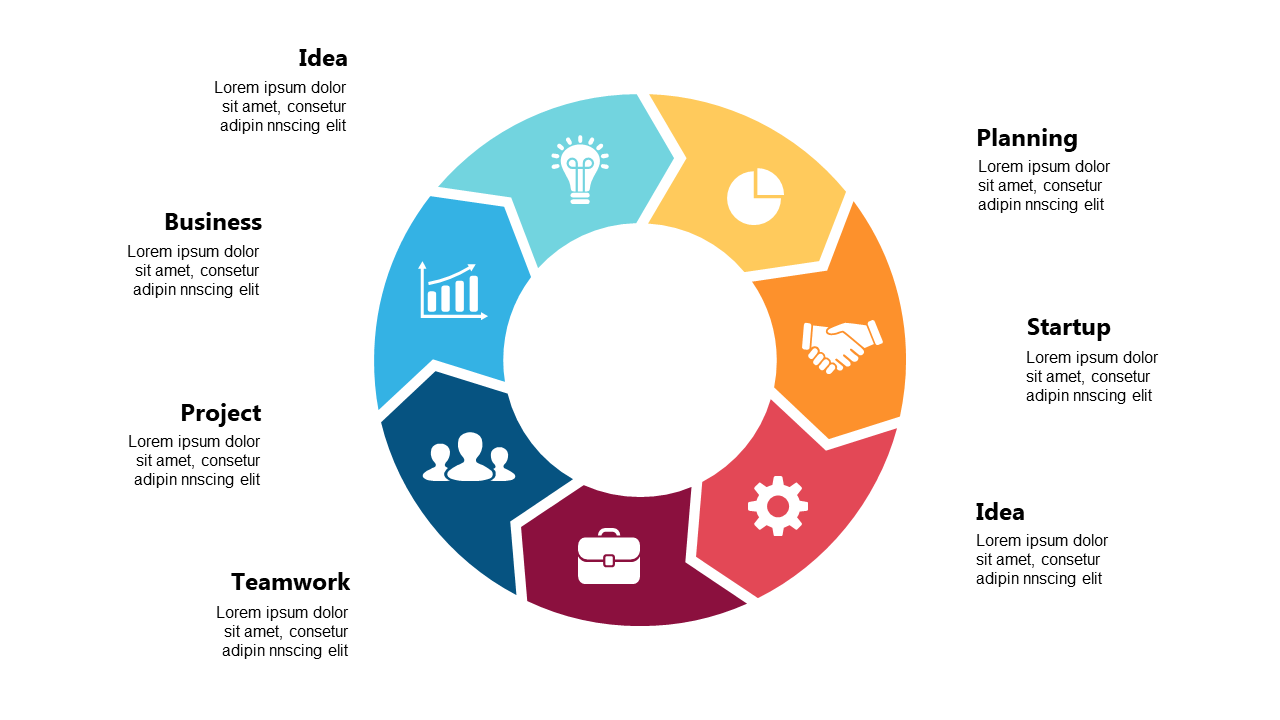
This slide, with its vibrant circular process diagram, divides information into distinct segments, making it easier to communicate. You’ll find this slide particularly useful in strategic planning sessions, brainstorming workshops, or even during executive presentations. If you’re a product manager delineating workflows or a marketing director unpacking multi-step campaigns, this visual tool will help keep your team engaged and aligned.
At just $0.99, this slide is ready for instant download and easy to edit in PowerPoint or Google Slides. You’ll be able to customize it to fit your needs and start using it within minutes.
$0.99 – Purchase Checkout
Added to cart