Visualize Data with a 6-Step Vertical Bar Chart
Product Description
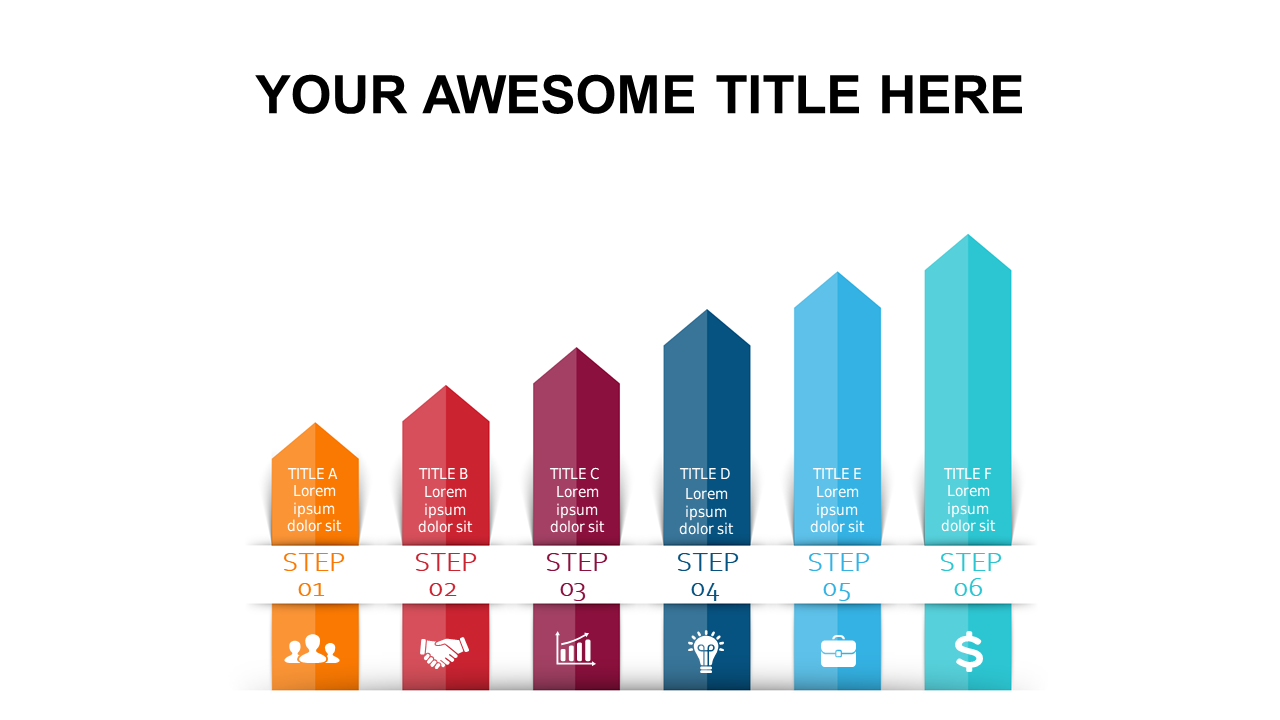
Presenting complex data in a way that’s easy to digest can often feel like an uphill battle. You need to ensure your audience can quickly grasp the key points without getting bogged down by too much detail. This 6-step vertical bar chart slide allows you to visualize your data effectively, turning potentially overwhelming information into a clear and compelling narrative.
This slide works wonders for analysts presenting quarterly results or sales professionals showcasing performance metrics. It’s also an excellent choice for academic researchers looking to display data findings during conferences.
By using this slide, you’ll communicate your insights with clarity and confidence. For just $0.99, you can get this slide instantly and start customizing it today. It’s easy to edit in PowerPoint and Google Slides, allowing you to tailor it to your specific needs in no time.
$0.99 – Purchase Checkout
Added to cart







