Present Data Comparisons with Vertical Bar Charts
Product Description
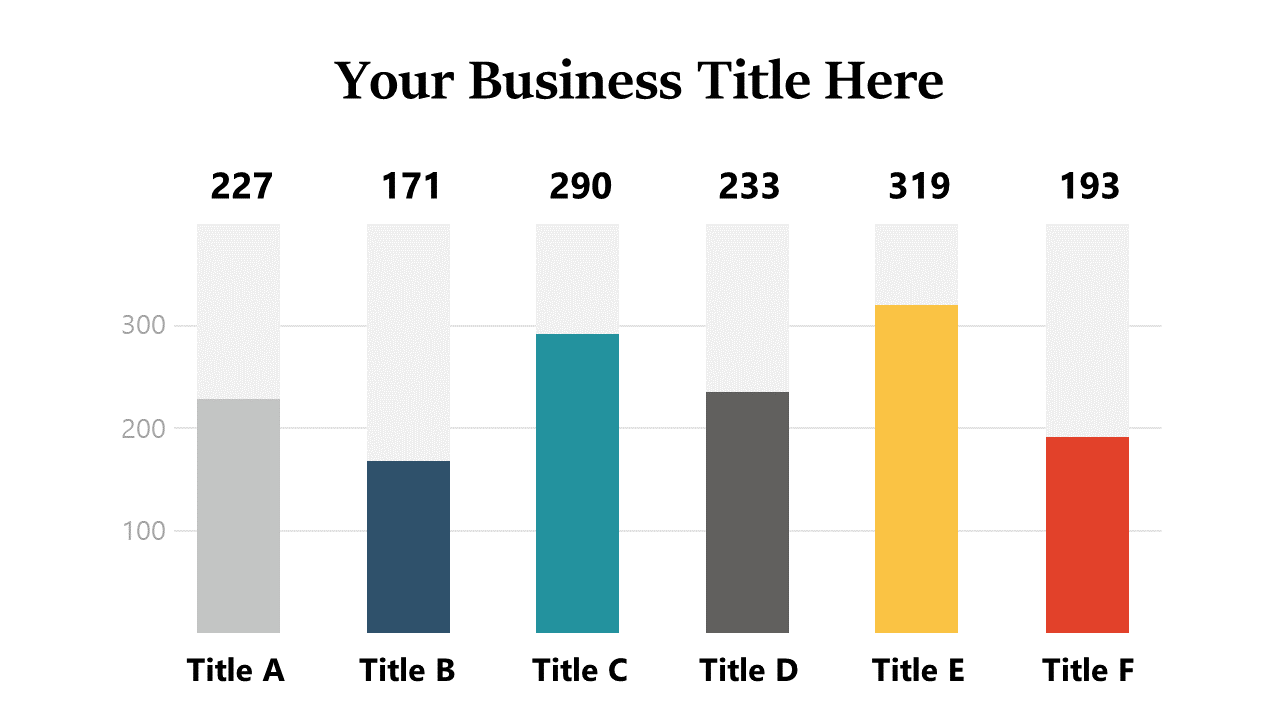
Presenting important data comparisons can be tricky if clarity is lacking. This vertical bar chart slide provides a straightforward visual representation, ensuring that key differences are easily understood by your audience. The design features prominent data labels, making it simple to convey your message effectively.
Use this slide during quarterly business reviews to showcase performance metrics or when presenting findings in a team meeting. Data analysts can also benefit from using this chart while reporting insights or trends.
It’s an invaluable resource for anyone needing to present data clearly and compellingly. You can download this slide immediately for just $0.99. It’s fully editable in PowerPoint and Google Slides, allowing for quick customization to fit your specific data needs.
$0.99 – Purchase Checkout
Added to cart







