Compare Data with Horizontal Bar Charts
Product Description
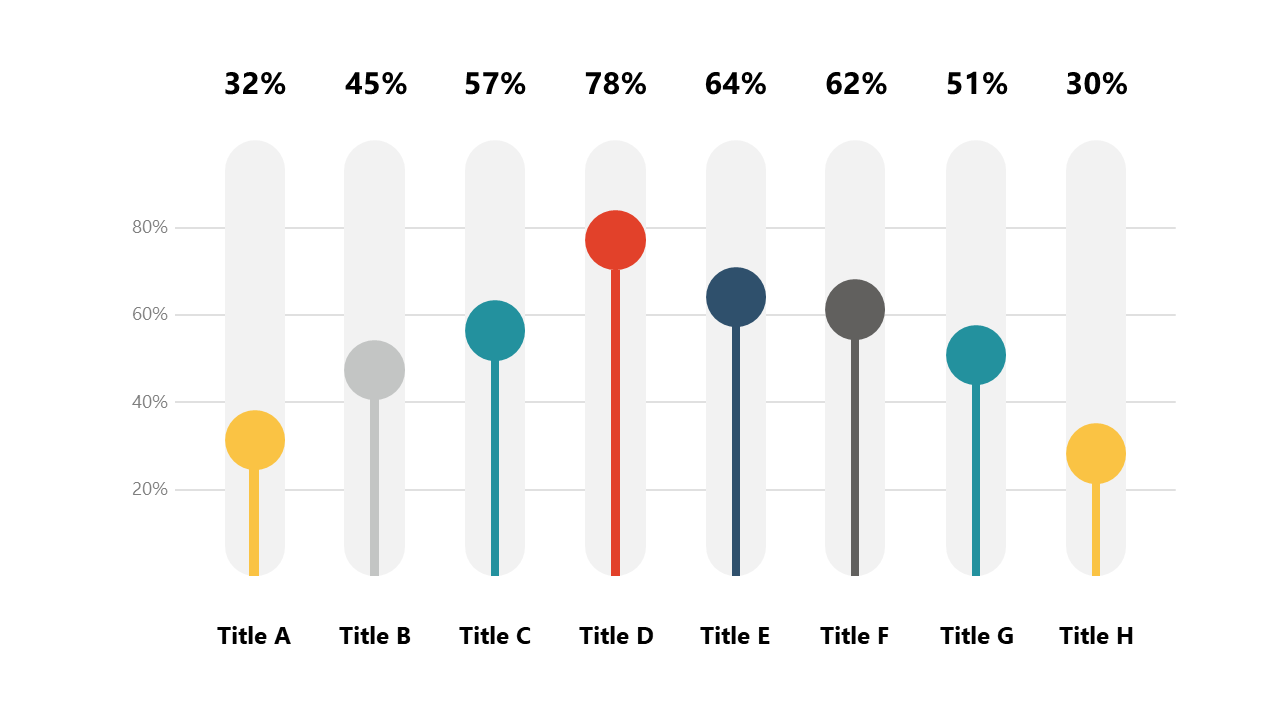
Making data comparisons clear is essential, especially when the stakes are high and decisions must be made quickly. If you’re struggling to present information in a straightforward way, this horizontal bar chart slide will be a lifesaver.
It allows you to display comparisons side by side, making the information digestible and impactful. This slide is ideal for financial analysts showcasing quarterly performance, project managers comparing timelines, or sales teams evaluating competitor metrics in strategy meetings. By using this slide, you can ensure that your audience understands the context of the data, leading to better decision-making.
Download this slide for just $0.99 and edit it easily to fit your needs. It’s available for immediate access and works seamlessly in both PowerPoint and Google Slides, so you can start impressing your audience right away.
$0.99 – Purchase Checkout
Added to cart







