Show Metrics with Horizontal Bar Charts
Product Description
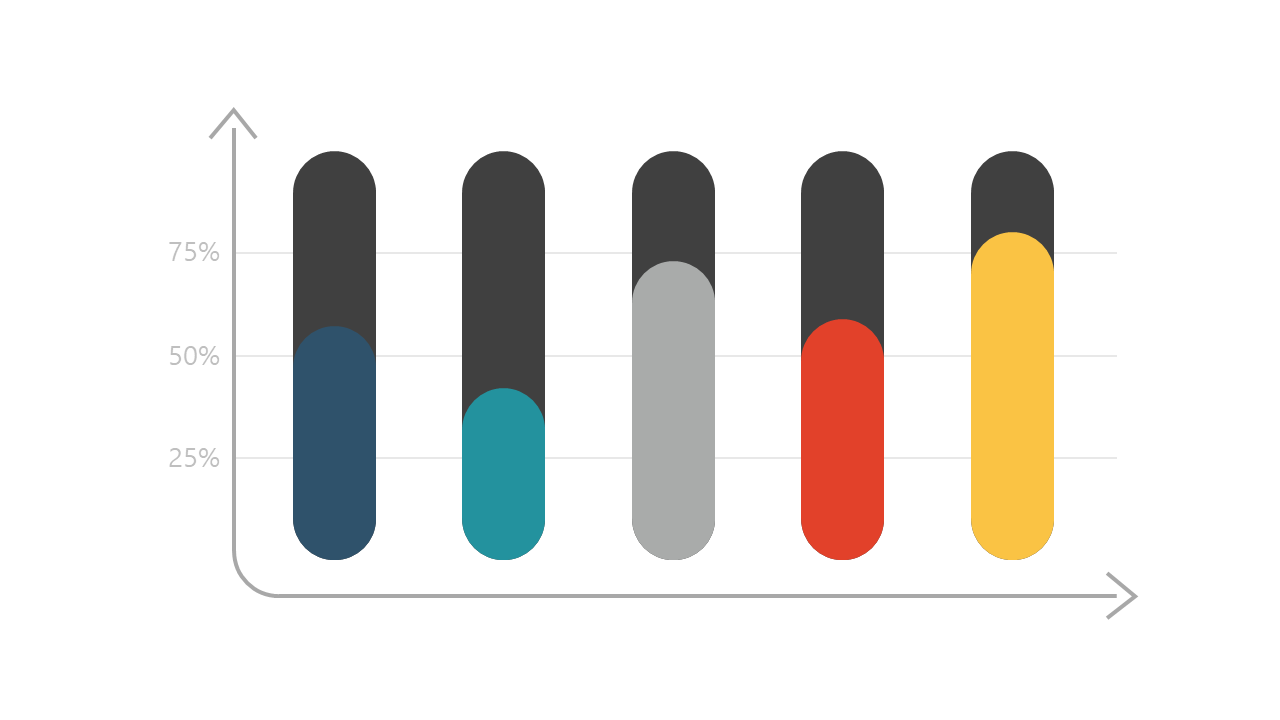
Presenting complex data to your audience can often feel overwhelming, especially when you’re trying to make comparisons between different metrics. A visually appealing horizontal bar chart helps clarify your points, turning abstract numbers into clear visuals that your audience can easily comprehend. This slide is designed to make data presentation engaging and effective.
Project managers, analysts, and sales directors will find this slide particularly useful during quarterly performance reviews or sales presentations. Whether you’re outlining sales figures, performance metrics, or survey results, this chart provides a straightforward way to communicate your data without losing your audience’s interest.
It’s perfect for anyone needing to present complex information in a digestible format. For just $0.99, you can instantly download this slide, easily editable in both PowerPoint and Google Slides. It’s designed for quick integration into your presentation, allowing you to transform data into impactful visuals in just minutes.
$0.99 – Purchase Checkout
Added to cart







