Highlight Data with Horizontal Bar Chart V2
Product Description
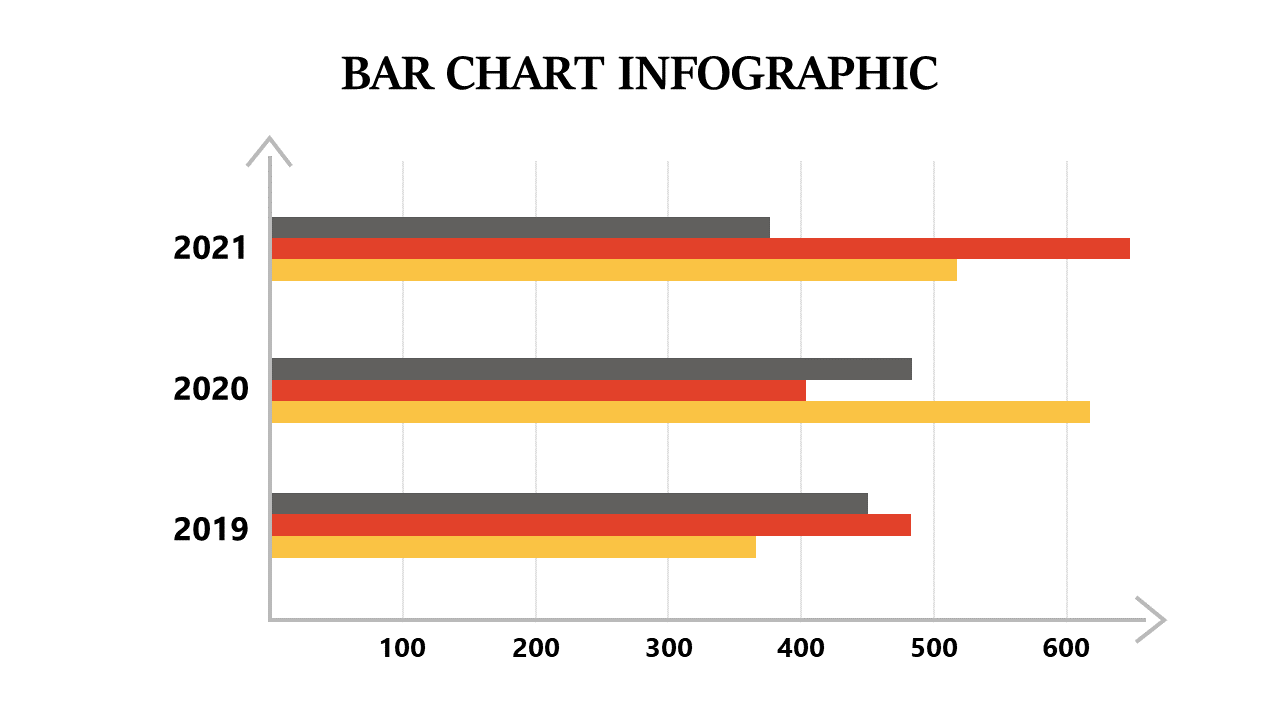
Navigating through extensive data can feel daunting, and the challenge lies in presenting those insights clearly. The horizontal bar chart V2 offers a visually striking way to break down and simplify complex information, making comparisons more intuitive for your audience.
Business analysts, data scientists, or anyone involved in market research will find this slide particularly useful during client presentations, team meetings, or strategy sessions. It fits perfectly into any scenario where data clarity counts, helping you make informed decisions based on visible comparisons.
At just $0.99, this slide is an instant download, so you can start using it right away. It’s easily editable in PowerPoint and Google Slides, letting you make necessary adjustments quickly before your next meeting.
$0.99 – Purchase Checkout
Added to cart







