Engage with Colorful Arrow Steps and Icons
Product Description
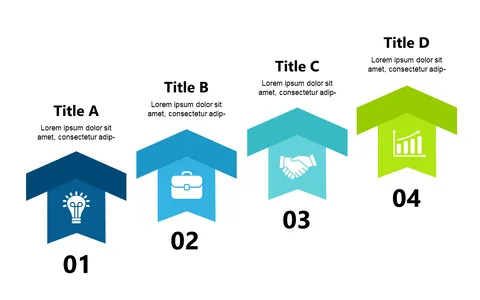
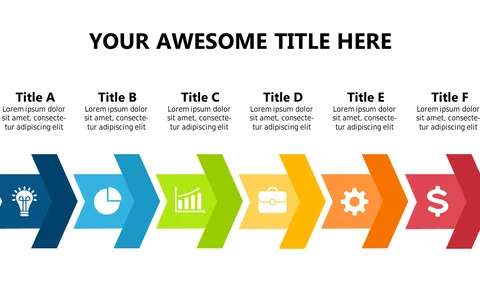
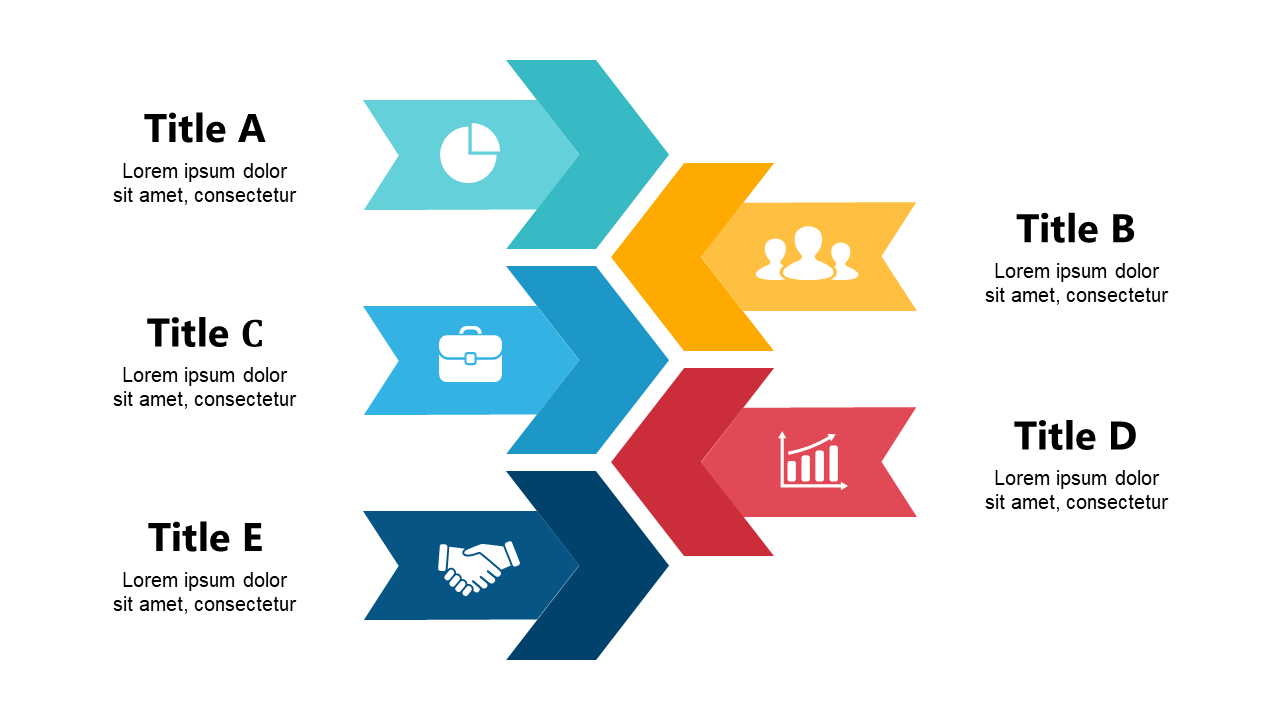
Communicating complex processes can often feel overwhelming, especially when your audience struggles to visualize the steps involved. This slide addresses that issue head-on by offering colorful arrows paired with intuitive icons, creating a clear and engaging visual journey. It’s designed to help your audience easily follow along, enhancing their understanding of your message.
This slide is perfect for marketing professionals presenting campaign strategies, educators explaining lesson plans, or any team leader walking through project milestones. Whether you’re in a brainstorming session or delivering a formal presentation, this slide will keep everyone on the same page and engaged.
For just $0.99, you get an instantly downloadable slide that’s ready to edit in both PowerPoint and Google Slides.
You can easily customize it to fit your needs and have it ready in minutes.
$0.99 – Purchase Checkout
Added to cart