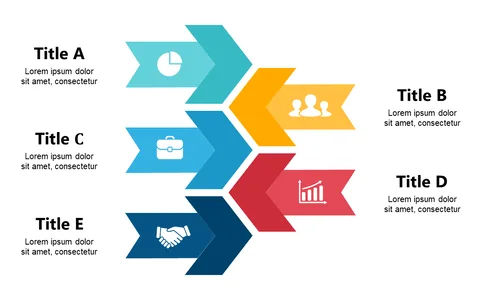
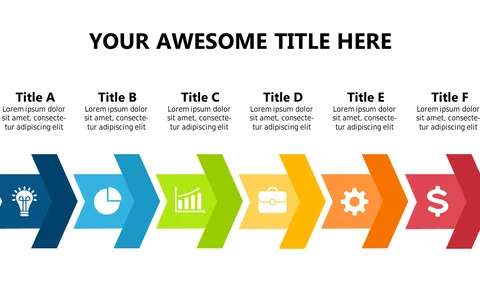
Chevron Steps with Icons for Key Concepts

Product Description
Explaining intricate processes can often lead to confusion and disengagement. This slide features colorful chevrons and icons that clearly outline key concepts, making it easier to present complex information in a logical format.
Your audience will follow along effortlessly, ensuring they understand the points you’re making. Perfect for process engineers, project managers, or operations specialists, this slide shines during project briefings, process documentation reviews, or training sessions. Use it to showcase workflow outlines, operational steps, or quality assurance processes, allowing your audience to grasp the information at a glance.
For only $0.99, you can instantly download this slide, making it straightforward to customize in PowerPoint or Google Slides. Elevate your presentations with ease in just a few minutes!
$0.99 – Purchase Checkout
Added to cart