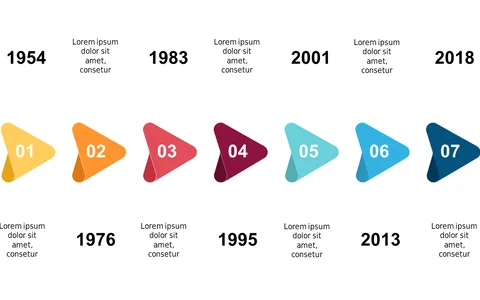
Outline Multi-Step Processes with Triangles
Product Description
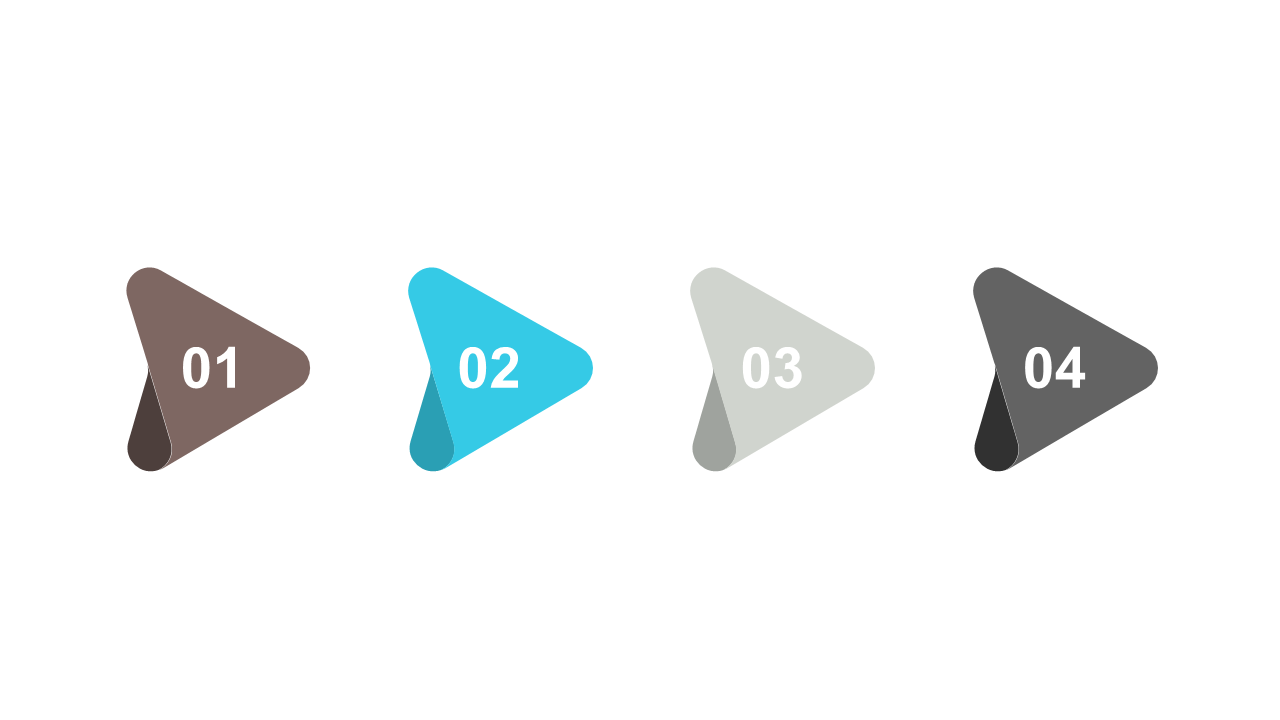
When you’re trying to explain a complex process, clarity is key. A jumbled explanation can leave your audience confused, and that’s the last thing you want during an important presentation. This layout presents a clean and structured way to outline each step in a multi-step process, making it easy for your audience to follow along.
Project managers working on product launches, educators designing lessons around new concepts, or marketers explaining campaign workflows will find this slide invaluable. Whether you’re detailing a project timeline, outlining educational goals, or presenting a marketing strategy, the triangles guide your audience through each phase succinctly.
For just $0.99, you can download this slide and have it ready in minutes. It’s fully editable in PowerPoint and Google Slides, so
you can easily customize the colors and text to match your branding or personal style.
$0.99 – Purchase Checkout
Added to cart