Dynamic Circular Diagrams for Business Presentations
Product Description
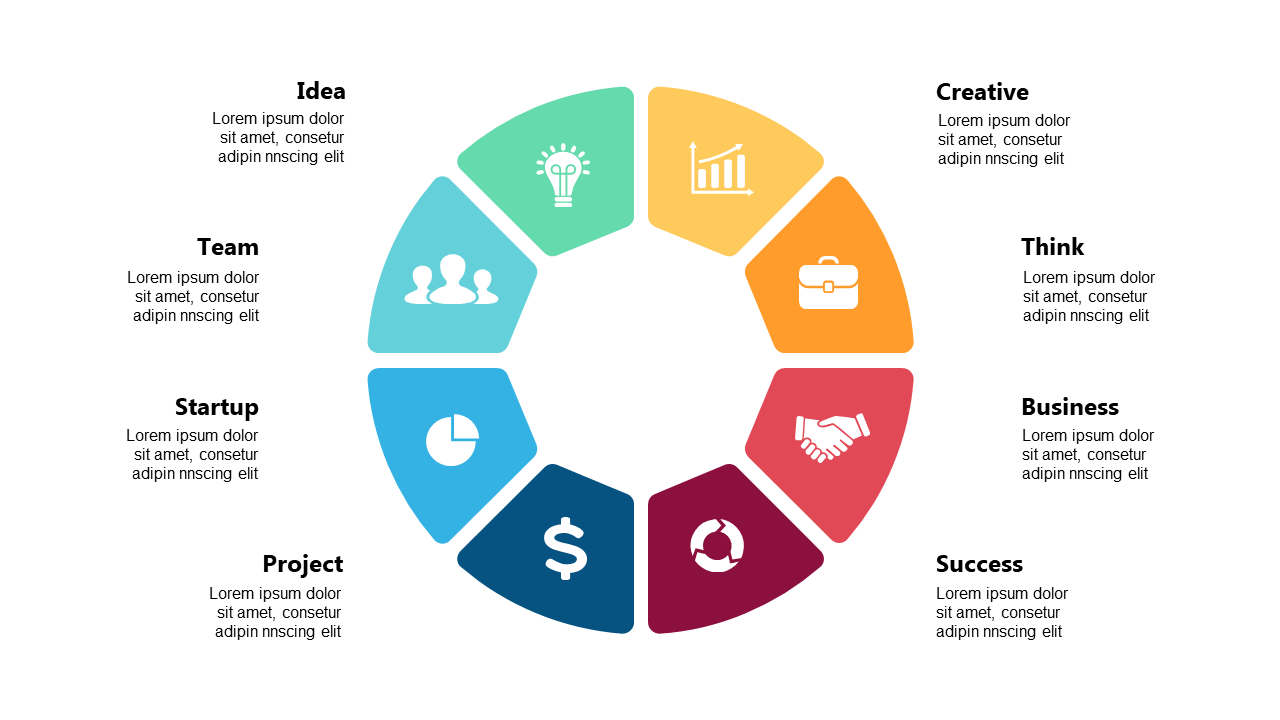
Illustrating complex cyclical processes in an understandable way is often a challenge in business presentations. You want to be clear and effective, ensuring your audience can easily follow along. This dynamic circular diagram does just that, providing a visually striking way to communicate key business concepts like innovation, analytics, and finance.
Ideal for operations managers reporting on workflows or consultants explaining data processes, this slide fits perfectly into various contexts. It can also be beneficial in strategy sessions or educational settings where clarity is paramount. The intuitive visual elements keep your audience engaged and attentive throughout your presentation.
At just $0.99, you can instantly download this slide and start editing it in PowerPoint or Google Slides.
Customization is user-friendly, allowing you to make it your own quickly and get your points across effectively.
$0.99 – Purchase Checkout
Added to cart







