Engage Audiences with Circular Process Visuals
Product Description
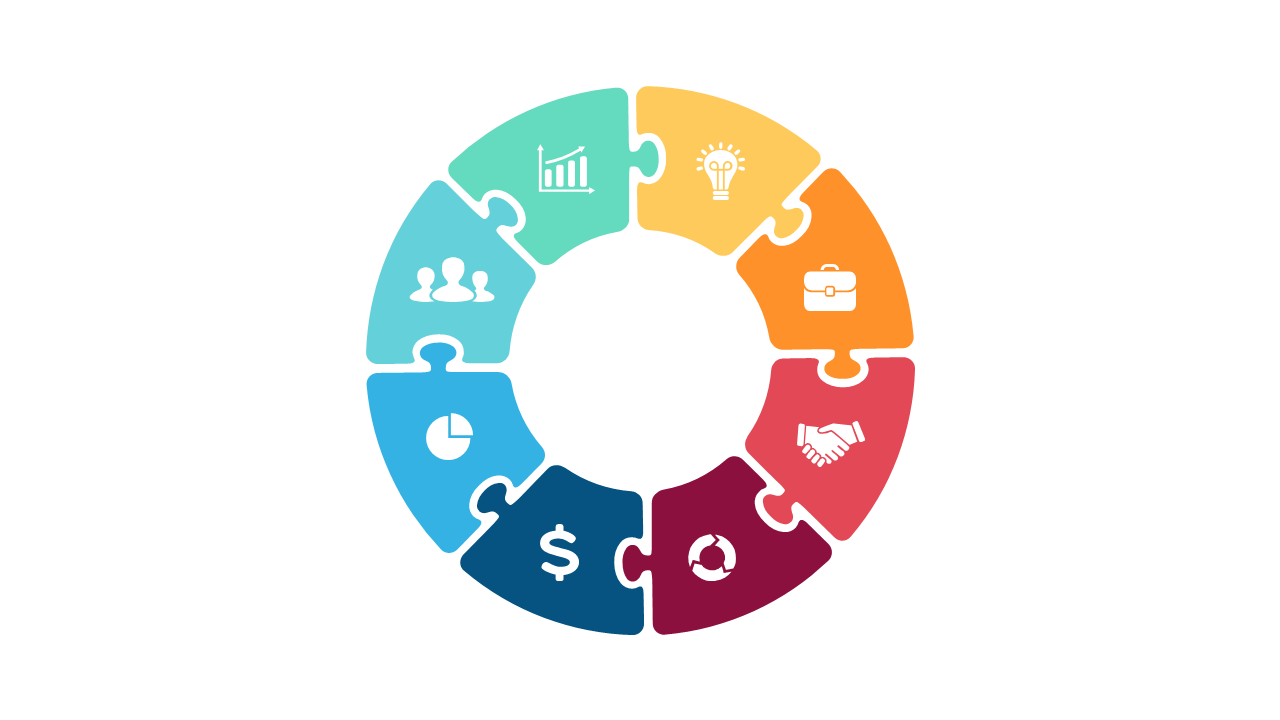
When trying to explain complex business processes, keeping your audience engaged can be a real challenge. You need a visual that not only looks great but also simplifies your message, making the cyclical nature of your concepts easier to understand. This slide offers a circular process visual that does just that, pairing appealing design with clear communication.
Consultants can use this in client presentations to clarify methodologies, while product managers might turn to it during product lifecycle discussions. Marketing teams can showcase campaign processes effectively, making this slide versatile for various industries and roles.
The bright segments and relatable icons ensure your audience stays focused on your ideas. Available for only $0.99, this slide is easy to download and edit in both PowerPoint and Google Slides. You can personalize it quickly, allowing you to spend less time on design and more on delivering your message.
$0.99 – Purchase Checkout
Added to cart







