Clarify Business Strategies with Cyclical Process Diagram

Product Description
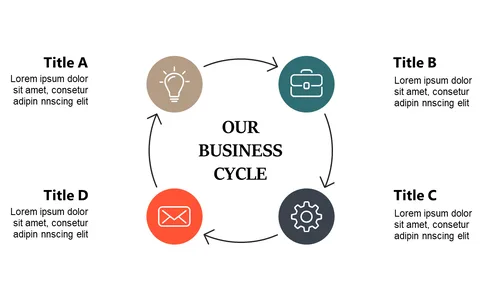
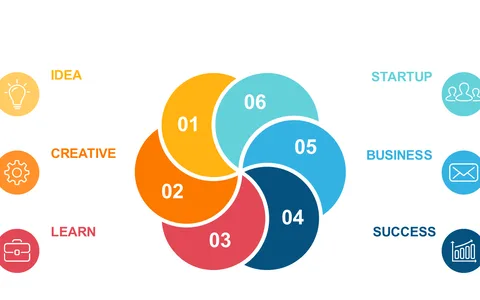
Navigating business strategies is no small feat, and attempting to articulate them clearly can lead to confusion if you lack the right visuals. This cyclical process diagram provides an easy-to-understand format that helps your audience visualize the flow of your initiatives. It simplifies complex concepts so that everyone stays on the same page.
This slide is perfect for business strategists presenting quarterly goals in board meetings or marketing managers outlining customer engagement strategies to their teams. Consultants can also use it when discussing recommended approaches with clients, ensuring that everyone fully comprehends the proposed plans.
Available for just $0.99, this slide is ready for instant download and can be easily edited within PowerPoint or Google Slides. With minimal effort,
you can customize it to suit your presentation needs and make a strong impression in no time.
$0.99 – Purchase Checkout
Added to cart