Show Continuous Improvement with Cyclical Process Diagram
Product Description
Communicating ongoing improvements can be a real challenge when you’re juggling multiple updates and trying to keep everyone on the same page. You need a way to make the process visually digestible, so stakeholders can see the progress without getting lost in the details.
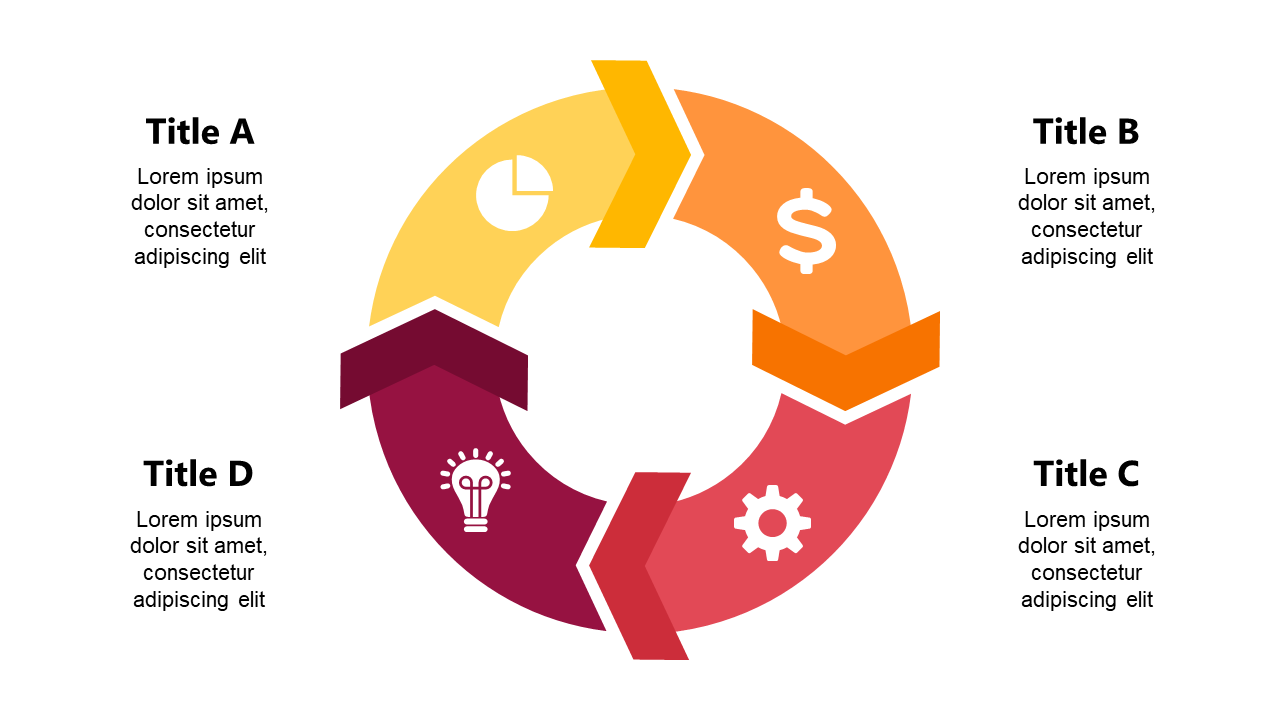
This slide provides a clear cyclical diagram that effectively highlights the continuous improvement initiatives you want to share. This visual tool is particularly useful for quality managers in manufacturing environments, project leads in tech companies detailing Agile processes, or even marketing teams analyzing campaign optimization. If you’re presenting at a quarterly review meeting or conducting a team workshop on process enhancements, this diagram will help convey your message in an engaging way.
For just $0.99, you can instantly download this slide, which is fully editable in PowerPoint and Google Slides. It’s designed to be user-friendly, allowing you to customize it to fit your specific needs in just a few minutes.
$0.99 – Purchase Checkout
Added to cart







