Visualize Business Processes with Circular Cycle Diagram

Product Description
Consultants often struggle to effectively communicate complex business processes to clients who may not have a technical background. Clarity is key when you’re working to ensure everyone understands the flow and interactions within a project or service.
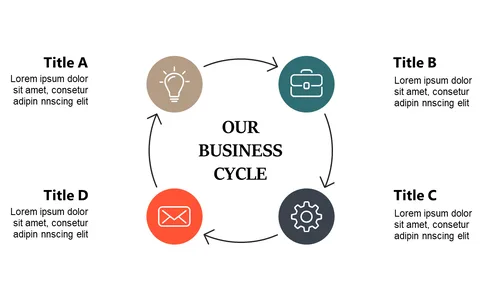
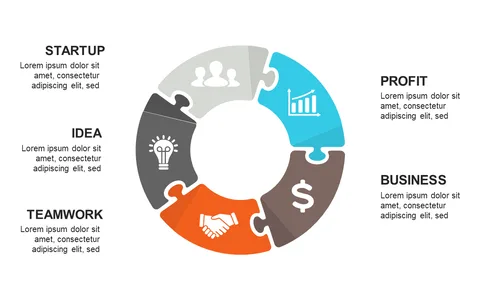
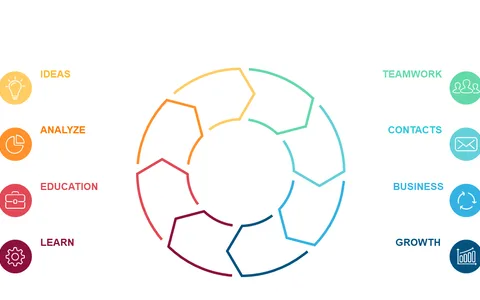
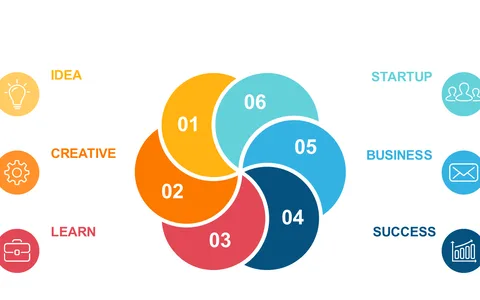
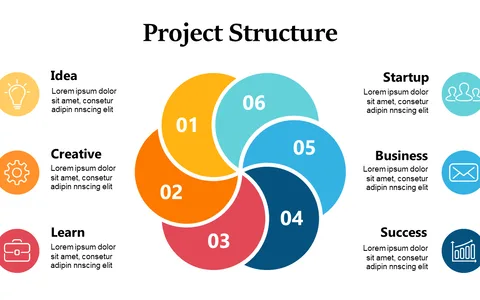
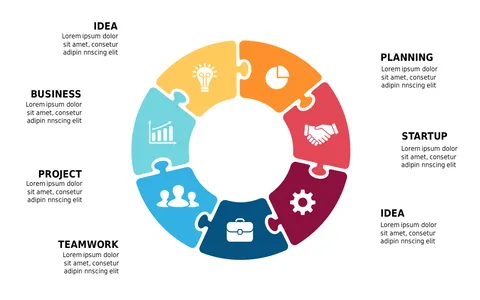
This circular cycle diagram makes it easy to break down intricate ideas into digestible visual segments. Ideal for project managers, business analysts, and consultants, this slide is perfect for client meetings, presentations, or internal strategy sessions. You can use it during project kick-offs or reviews, where you need to illustrate how various elements contribute to overall success and identify improvement areas.
For just $0.99, you’ll get an instantly downloadable slide that you can edit in PowerPoint or Google Slides. Customize it to fit your needs and start presenting with confidence in just minutes.
$0.99 – Purchase Checkout
Added to cart