Effective Circular Cycle Diagram for Business Growth

Product Description
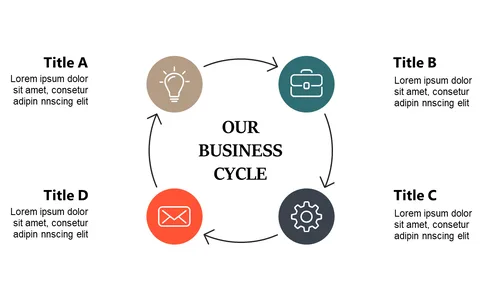
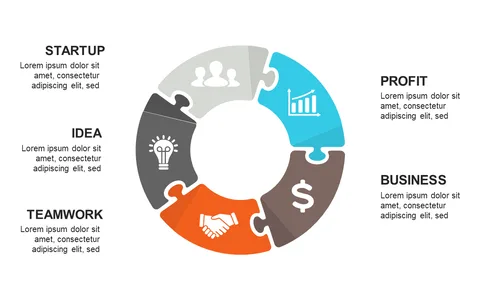
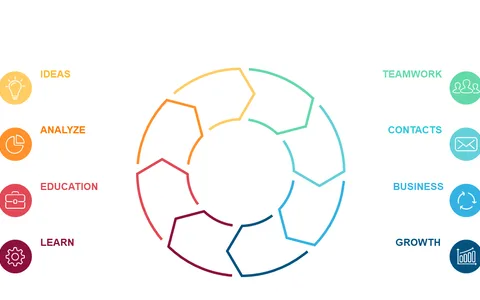
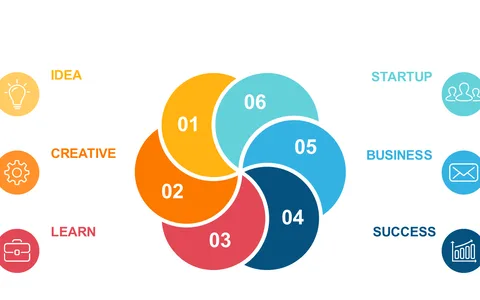
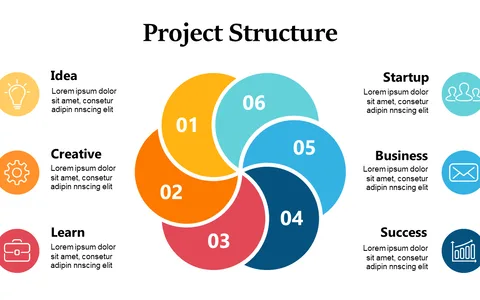
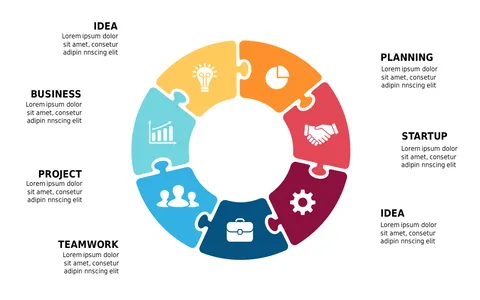
As an operations manager, you understand how challenging it can be to represent complex processes visually. This circular cycle diagram is designed to simplify your life by depicting business growth and the connections between various operational elements.
It breaks down your message into clear, defined segments, so your audience can follow along effortlessly. This slide suits professionals in roles like logistics coordinators, business development managers, or project leaders, particularly during operational reviews, growth strategy meetings, or team alignment sessions. Using this diagram will help you convey your points effectively and keep your audience engaged.
For just $0.99, you can download this slide and enhance your presentation immediately. It’s fully editable in both PowerPoint and Google Slides, allowing you to make adjustments that suit your specific context in just a matter of minutes.
$0.99 – Purchase Checkout
Added to cart