Customizable Circular Cycle Diagram for Presentations

Product Description
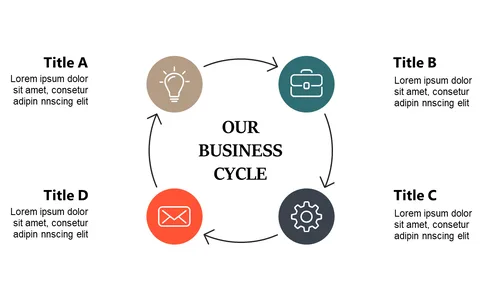
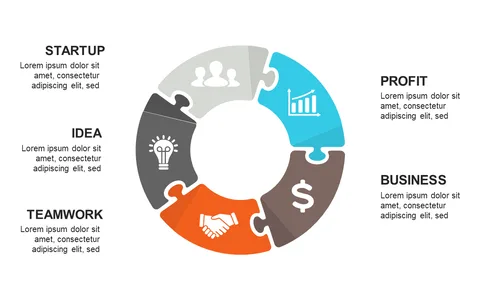
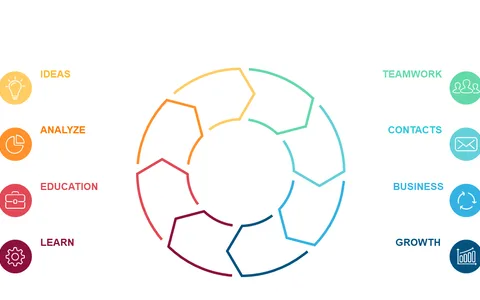
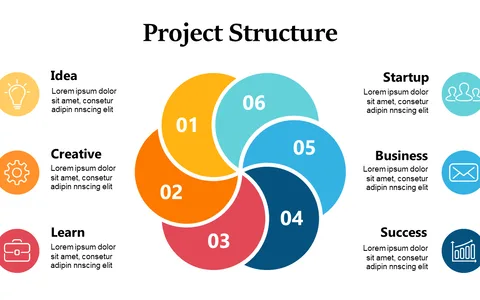
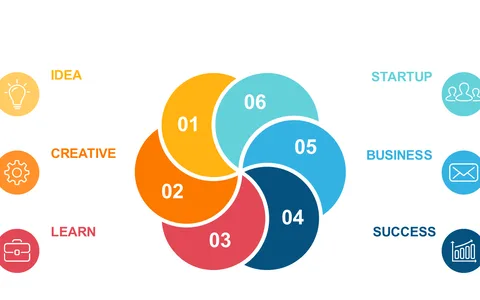
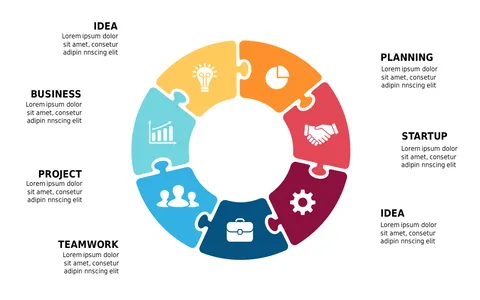
Communicating complex ideas can often confuse your audience, especially when the stakes are high in a strategy meeting. This customizable circular cycle diagram provides a visually appealing way to present intricate business processes, making your message clearer and more memorable.
It’s designed to help ensure everyone stays aligned and engaged. This slide is perfect for strategy managers, business analysts, and project leads who need to present detailed information in a digestible format. Whether you’re in a brainstorming session or a project review, this diagram can serve as a key visual aid that sparks discussions and reinforces your points.
Available for only $0.99, this slide offers an instant solution to your presentation needs. You can quickly download it and make edits in PowerPoint or Google Slides, giving you a customized visual ready in minutes.
$0.99 – Purchase Checkout
Added to cart