Engaging Circular Cycle Diagram for Corporate Ideas

Product Description
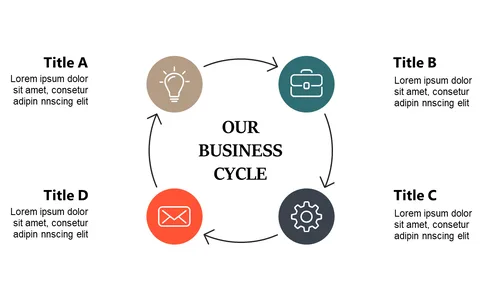
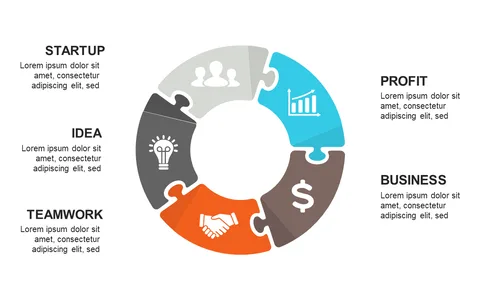
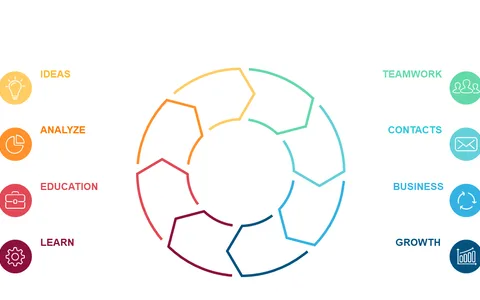
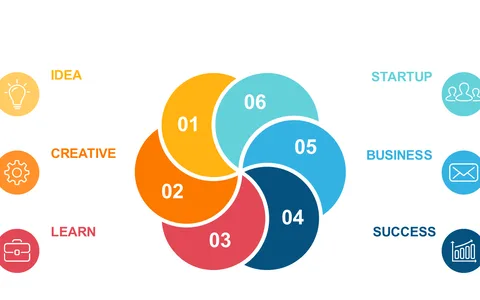
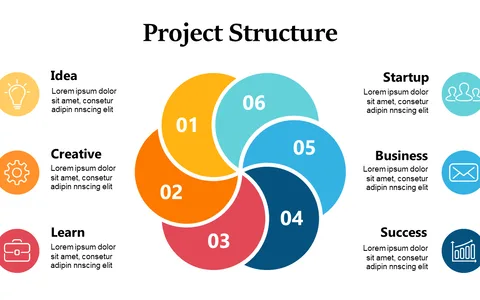
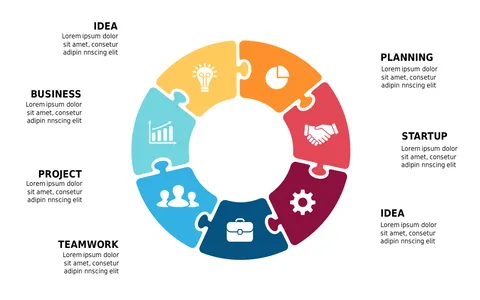
When presenting intricate ideas, a clear visual can be a game changer in making your points resonate. This engaging circular cycle diagram helps articulate key business processes simply and effectively, designed to both capture attention and enhance understanding. It’s an ideal way to illustrate concepts without overwhelming your audience.
You’ll find this slide useful in various corporate settings, whether you’re a product marketer preparing for a pitch, a consultant discussing strategies with clients, or an operations director conducting team training. It’s perfect for meetings that require clarity, like project kickoff sessions or executive briefings where every detail matters.
For just $0.99, you can download this slide to elevate your presentations instantly. It’s fully editable in PowerPoint and Google Slides, ensuring
you can customize it to fit your needs quickly and efficiently.
$0.99 – Purchase Checkout
Added to cart