Visualize Progress with Circular Milestones

Product Description
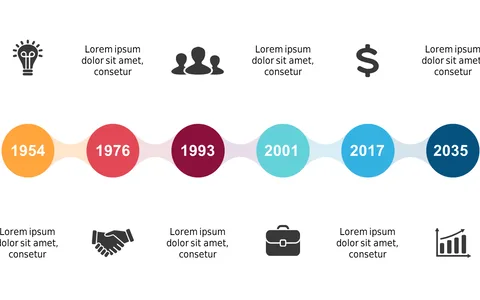
As an operations manager, showing progress can often feel like a complex task, especially when trying to maintain engagement with your audience. This striking slide features circular milestones complemented by icons that clearly represent different achievements, making information easy to digest.
Ideal for project coordinators detailing key phases in a timeline, team leads discussing workflow improvements, or anyone needing to illustrate progress, this slide fits perfectly into your presentations. Envision using it during operational reviews or team check-ins to highlight growth and milestones.
For only $0.99, you can download this slide instantly and customize it in PowerPoint or Google Slides. Editing is simple, ensuring you can convey your progress effectively and efficiently.
$0.99 – Purchase Checkout
Added to cart